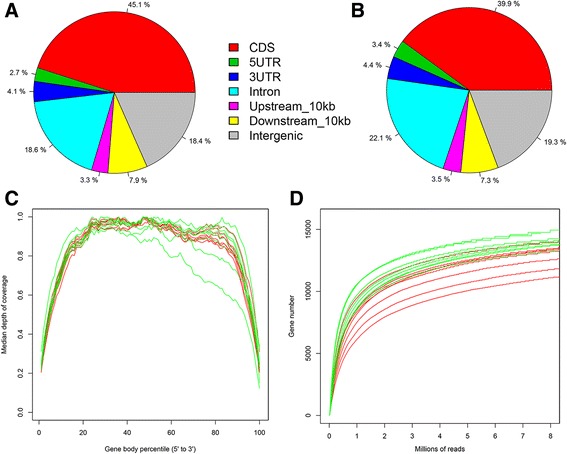
Fig. 1.

Quality and features of the RNA-seq datasets obtained from testis of male sheep. Distribution of the RNA-seq reads from High Diet group (a) and Low Diet group (b) along the annotated features of the sheep genome. c Relationship between the RNA-seq read coverage and the length of the transcriptional unit. The x-axis indicates the relative length of the transcripts. d Saturation curve for gene detection. Randomly sampled reads are plotted against the expressed genes
