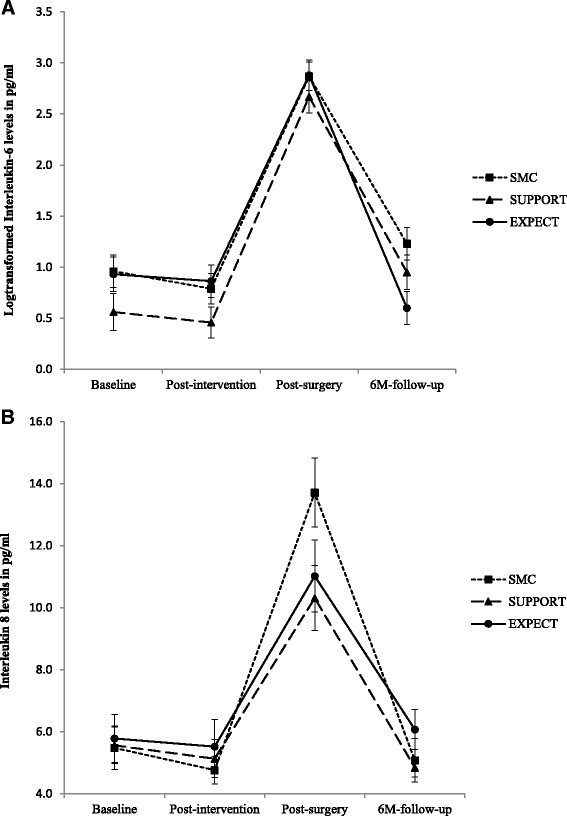
Fig. 3.

Interleukin-6 (log transformed because of distribution violations) (a) and interleukin-8 levels (b) by treatment groups at baseline, after intervention, after surgery, and 6 months after surgery. * significant group differences at P < 0.05. Data from estimated marginal means analyses. SMC standard medical care, SUPPORT supportive therapy, EXPECT expectation manipulation intervention
