
Fig. 1.
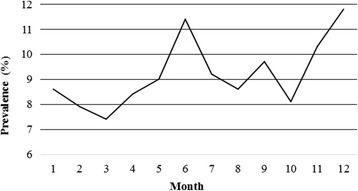
Distribution of P. multocida isolates by the sampling month between February 2011 and October 2015. The isolation rates were 19/222, 20/253, 22/296, 25/297, 21/233, 38/332, 28/303, 24/280, 21/217, 21/260, 29/281, and 28/238 for months 1–12, respectively. The isolation rates given are the average isolation rates per month over the 5-years study period. The highest isolation rates were recorded in month 12, followed by months 6, 11, and 9. However, as a whole, differences in the isolation rates were not significant (p > 0.05). Statistical analysis was performed using the χ 2 test