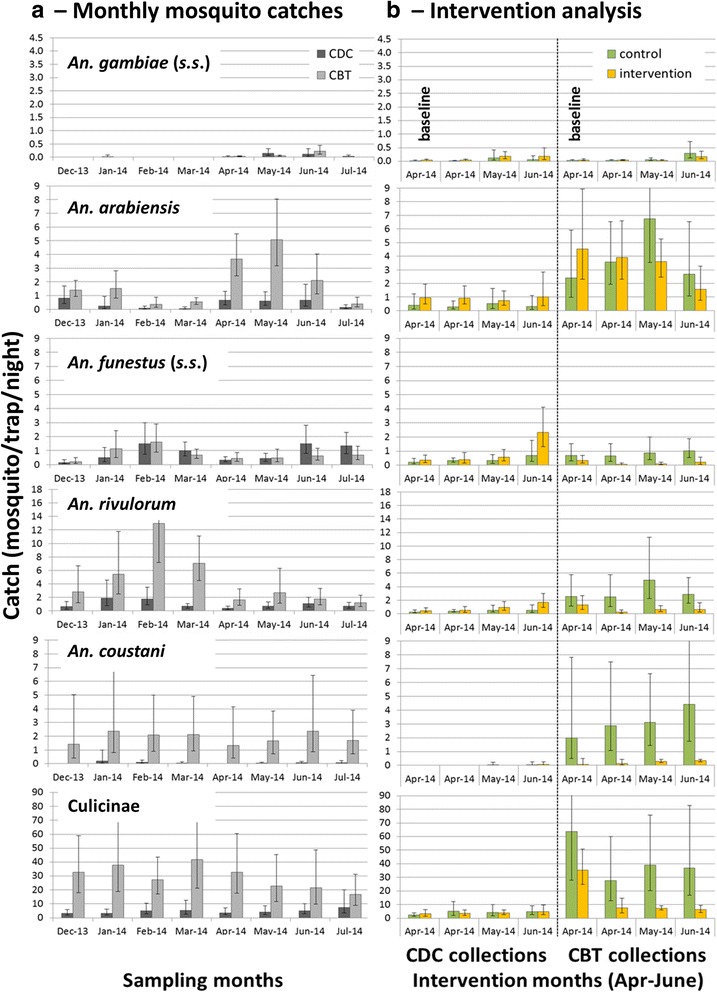
Fig. 7.

Mean numbers of mosquitoes collected per trap night. a Catch per mosquito species per trap night per month for CDC light trap and CBT collections. b Catch per mosquito species per trap night for intervention period only, comparing control and intervention sites separately for CDC light traps (left side of graphs) and CBTs (right side of graphs). The first data point from April shows the mean for half the month at baseline. The vertical bars show the 95% confidence interval
