FIGURE 1.

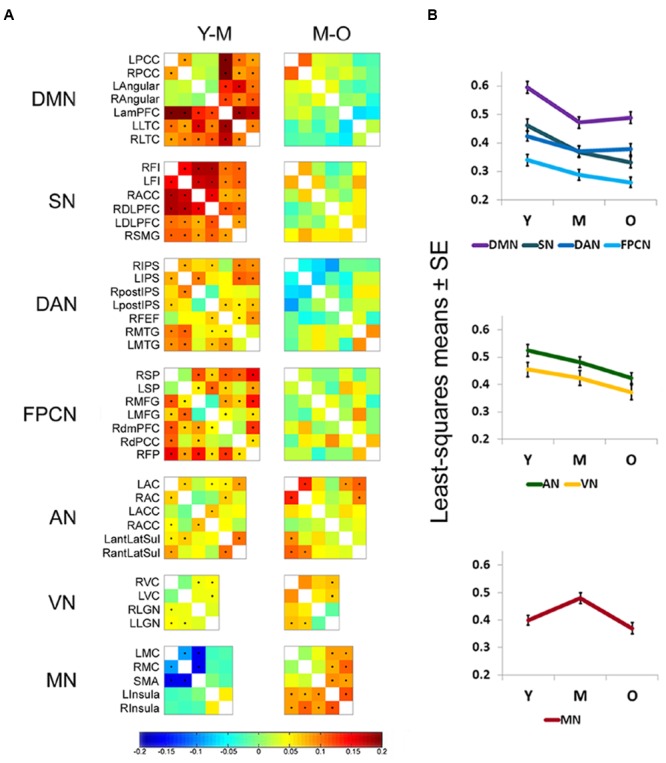
Early age-related connectivity decline in high-order cognitive networks. (A) Difference matrices of young vs. middle-aged (Y-M) and middle-aged vs. old (M-O) participants (entire cohort, n = 887) are shown for each network. Rows and columns of matrices denote the ROIs that were chosen to represent each network (see Table 3). Matrix entries represent the age group difference in connectivity strength [z(r) value] for each node pair. Entries marked by a dot survived FDR correction for multiple comparisons. In general, a significant connectivity decline is observed in high-order cognitive networks in the transition between young and middle adulthood. Within the AN and VN significant reductions are observed in some pairs for both transitions, Y to M and M to O. The MN mostly shows early connectivity increments and late connectivity decrements. See Table 3 for regions full name. (B) ANCOVA results of the network × age group interaction [performed on a subset of the entire cohort (n = 318)] are presented as least-squares means ± standard error (SE). Connectivity reduction within high-order cognitive networks is more pronounced in the comparison between Y to M than between M to O. The AN and VN show connectivity reduction in both transitions, with a more prominent decline in the transition between M to O. The MN shows an early significant connectivity increment followed by a late significant decrement.
