
Fig. 5.
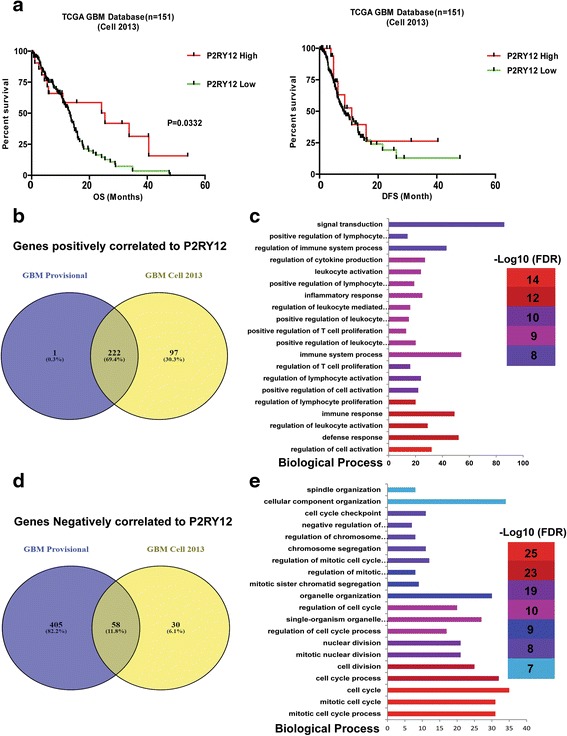
Analysis of TCGA datasets: High expression levels of P2RY12 in GBM patients predict a favorable outcome. a: Kaplan-Meier curves showing disease free survival and overall survival curves of patients with different P2RY12 expression levels. b: Overlap of the genes found in the two datasets that positively correlate with P2RY12 expression. c: Top 20 most significant biological processes resulting from functional annotation of the 222 overlapping genes. The GO terms are shown on the y-axis. The numbers of input genes per GO term are indicated on the x-axis. d: Overlap of the genes found in the two datasets that negatively correlate with P2RY12 expression. e: Top 20 most significant biological processes resulting from functional annotation of the 58 overlapping genes. The GO terms are shown on the y-axis. The numbers of input genes per GO term are indicated on the x-axis