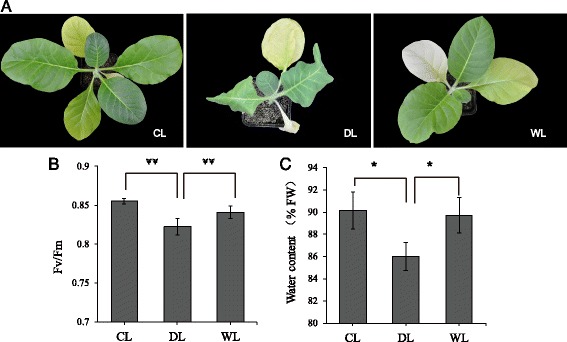
Fig. 1.

Gross phenotypes and physiological analyses of tobacco plants from the control, drought stress, and re-watering treatment groups. The growth status of control, drought-stress, and re-watering plants (a). Bar graph depicting the results from a chlorophyll fluorescence measurement of CL, DL, and WL leaves (b). Bar graph depicting the water content measurement results for CL, DL, and WL leaves (c). Data are presented as means ± S.D. (n = 7). Student’s t-test,** P-value < 0.01 considered highly significant; * P-value < 0.05 considered significant
