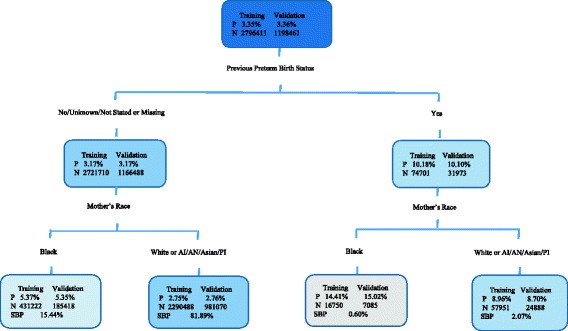
Fig. 3.

Classification and Regression Tree model for predicting ePTB. Legend: The probability of ePTB (P) and the number of subject (N) are all given inside of each node for both training and validation cohort. In each end node, the subgroup birth prevalence (SBP) is also calculated. AI = American Indian; AN = Alaskan Native; PI = Pacific Islander
