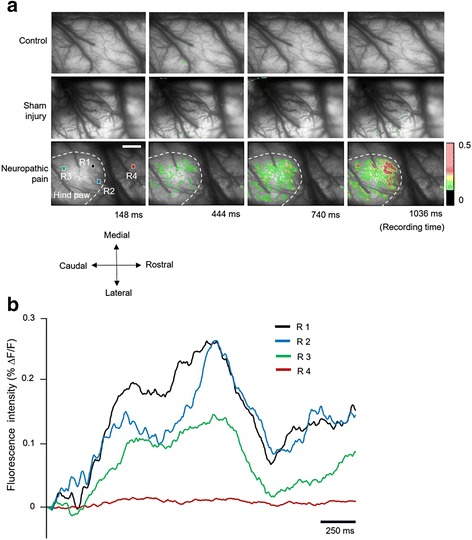
Fig. 3.

Spatiotemporal neural activity after electrical stimulation of the receptive field. a Four time-dependent images in each row show the change in neural activities and propagated activated area at each time point. Upper row indicates the S1 cortex in the normal control rat brains. Middle and bottom rows show the S1 regions of sham surgery and nerve-injured rats, respectively. Time-dependent fluorescence activities and activated areas were observed and analyzed (scale bar = 800 μm). b Each optical signal was observed from four colored squares in A (R1: Black, R2: Blue, R3: Green, and R4: Red). After electrical stimulation, neural activities reflected by fluorescence showed immediate changes. However, there was less activity signal changes recorded at the red square (outside of the activated area) (scale bar = 250 ms)
