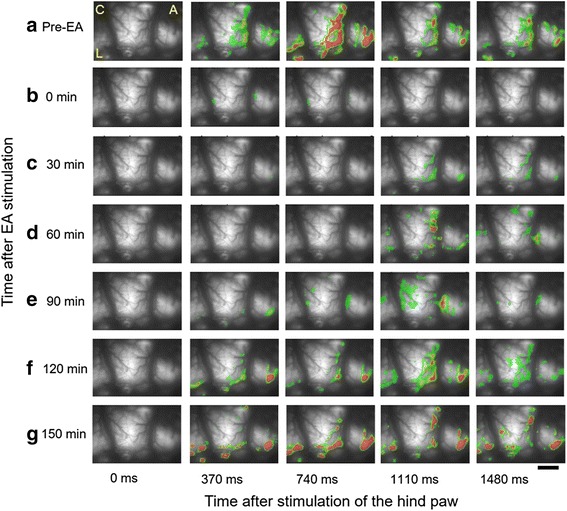
Fig. 4.

Spatiotemporal activity maps of optical activity during recording time. The five images in each row indicate frames consisting of every 100th frame in recording time. a Following electrical stimulation of the receptive field before EA in nerve-injured rats, significantly activated signals were detected. b Following electrical stimulation of the receptive field immediately after EA, intensity and activated area of fluorescence were typically reduced. c, d, and e Reduced and weak signals were observed 30, 60, and 90 min after EA. f and g By 120 and 150 min after EA, optical signals gradually recovered (C: caudal, A: anterior and L: lateral, scale bar = 800 μm)
