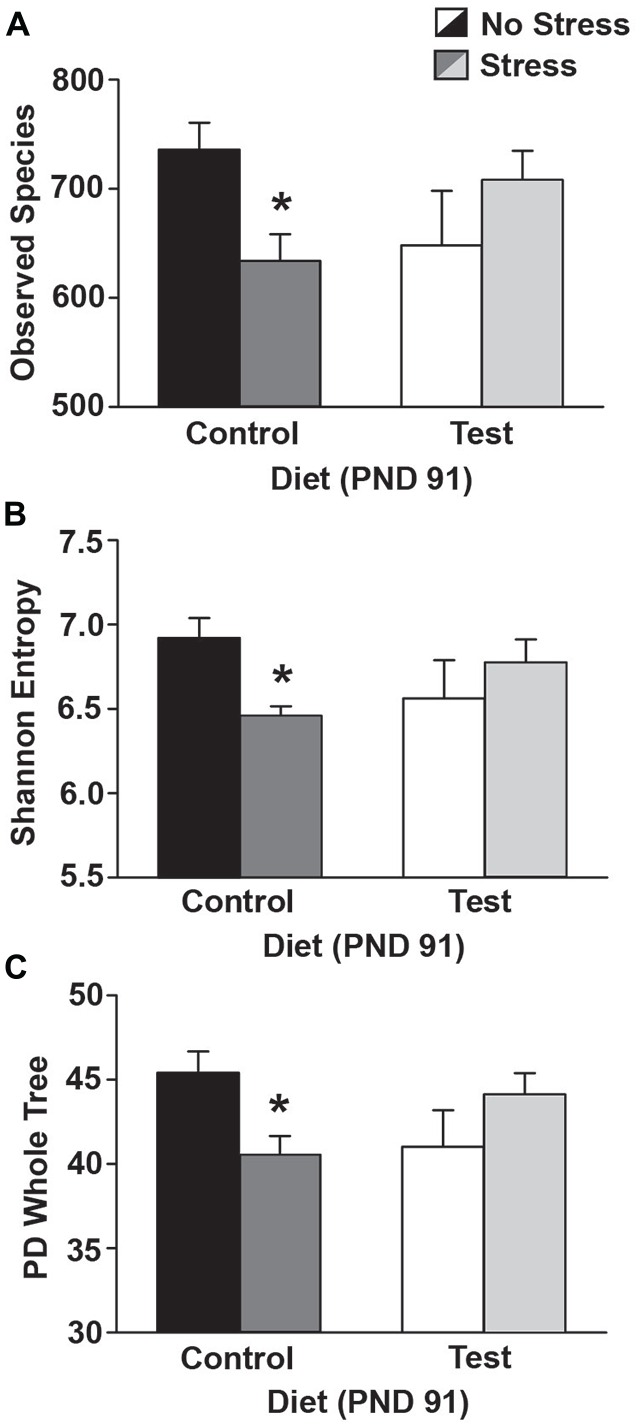
Figure 7.

Alpha diversity. Data depicting three measures of alpha diversity. (A) Stress exposure reduced the number of observed species in rats on the control diet, but rats on the test diet were protected from this reduction in the number of observed species. (B) Stress exposure reduced Shannon Entropy in rats on the control diet, but this effect was attenuated in rats consuming the test diet. (C) Similarly, stress reduced PD whole tree analysis, but only in rats on the control diet. Abbreviations are as follows: PD, phylogenetic diversity; PND, post natal days (*p < 0.05 vs. control diet, no stress).
