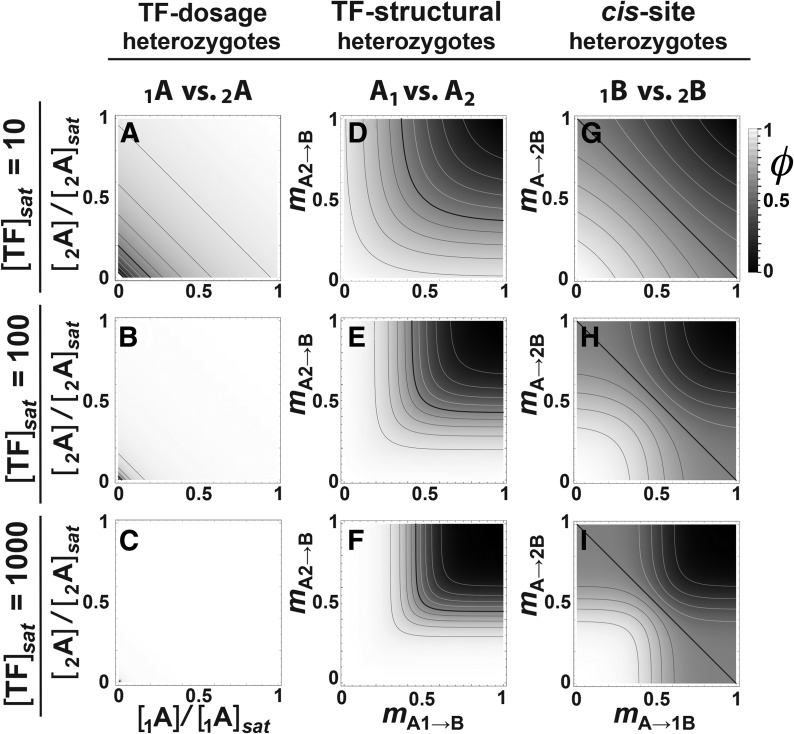
Figure 2.
Genotype–phenotype maps in the two-locus regulatory pathway with competitive transcription factor (TF) binding. Genotype–phenotype maps, shown as density plots of expression level (φ), equivalent to phenotype in this model (φ = P). Rows: Three saturating TF concentrations ([TF]sat) at maximal binding (mA1→B = mA2→B = 0). (A–C) Effects of allelic variation in TF dosage, scaled to allele-specific [TF]sat. (D–F) Effects of allelic variation in the TF coding region expressed as mismatch (m) with a homozygous cis-site promoter BB. (G–I) Effects of allele-specific variation in the cis-site, holding the TF homozygous. Isoclines throughout represent intervals of 0.1 and the black isocline represents φ = 0.5.

