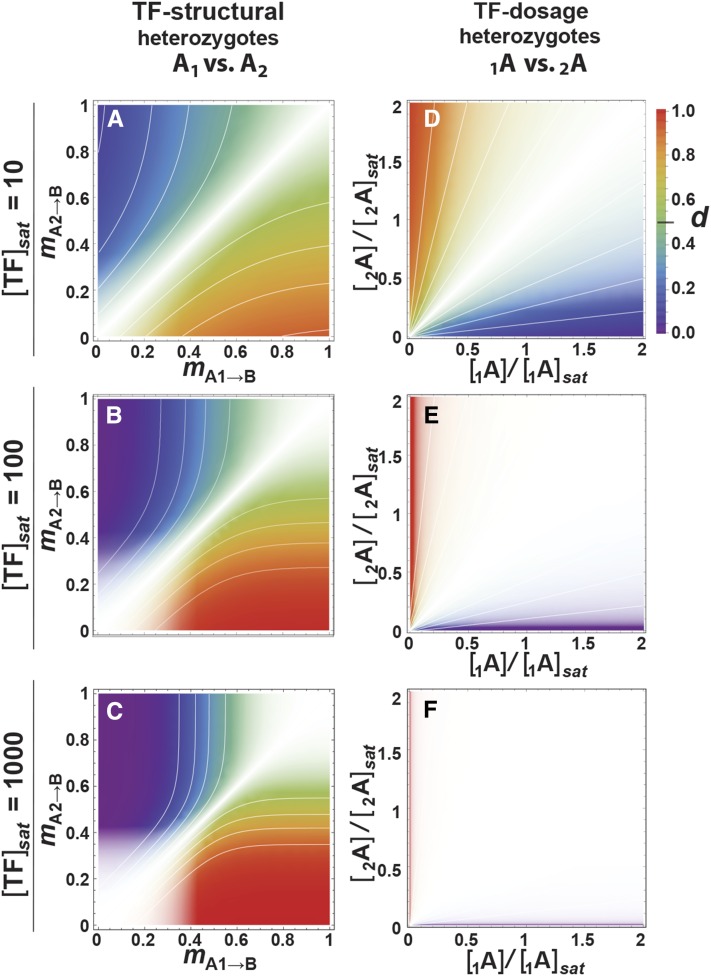
Figure 4.
Detectability of dominance with respect to genotype. White opacity-gradient masks overlay the genotype-dominance maps of the corresponding panels of Figure 3, A–F, such that the intensity of underlying color represents the detectability of dominance. Isoclines throughout represent intervals of 0.1. TF, transcription factor.

