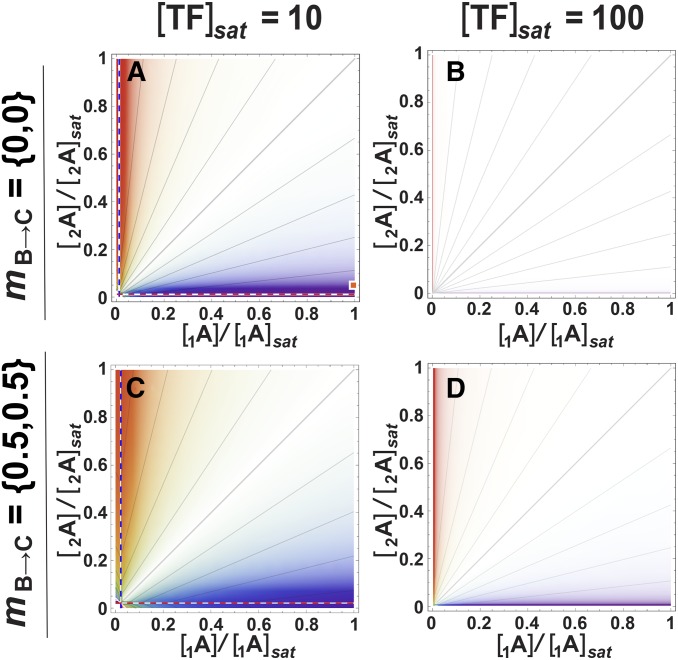
Figure 7.
Pattern and detectability of dominance of allele-specific concentration differences of TF locus A in the three-locus pathway, in relation to saturating TF concentration and binding strength in the B→C step. (A–D) White opacity-gradient masks overlay the genotype-dominance maps, proportionally obscuring regions of low detectability. Notation: mB→C = {x,y} means that mB1→C = x and mB2→C = y; locus B is homozygous when x = y. (A) The orange square represents the same parameter conditions as the orange square in Figure 6G, i.e., Figure 6G examines genetic background effects on dominance at a point where the 1A allele has maximal dosage and the dosage of the 2A allele is very low. Isoclines throughout represent intervals of 0.1.

