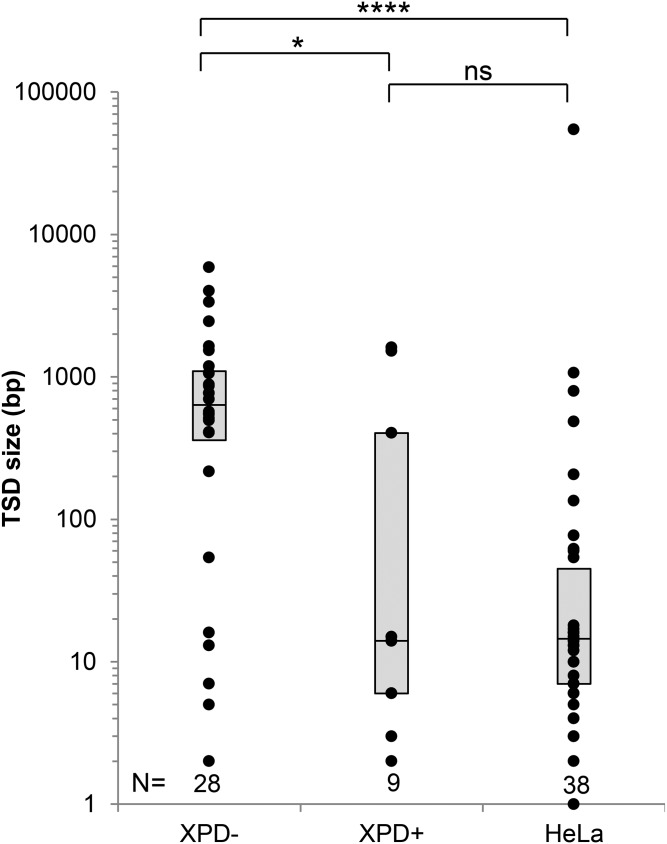
Figure 4.
Recovered de novo L1 inserts in NER-deficient cells have large TSDs. Dot plot representation of the size of TSDs of de novo L1 inserts recovered from XPD-deficient cells (XPD-), stably complemented XPD-deficient cells (XPD+) and HeLa cells. The boxes represent the interquartile range (the range between the first and third quartiles) of the distribution of TSD size for each cell line. The line in the middle of the box represents the median. The count (n) of recovered inserts for each cell line is indicated above the name of the cell line. Statistical significance is indicated by *P-value = 0.032, ****P-value = 3.13 × 10⁻⁷ (P-value = 0.38) (Mann–Whitney U test). NER, nucleotide excision repair; TSD, target site duplication.

