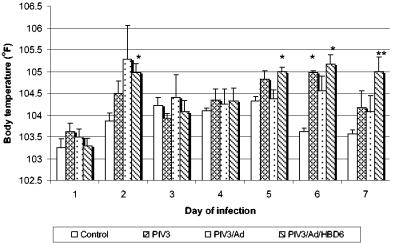
FIG. 1.
Body temperatures for the treatment groups. The animals in the PIV3 group had significantly increased body temperatures compared with those of the animals in the control group on day 6, while the animals in the PIV3/Ad/HBD6 group had increased body temperatures compared with those of the animals in the control group on days 2, 5, 6, and 7. *, P < 0.01 compared with the results for the controls; **, P < 0.05 compared with the results for the controls.

