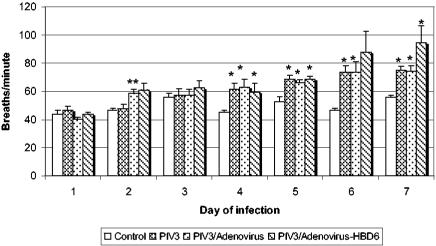
FIG. 2.
Respiration rates for treatment groups. On day 2 the animals in the PIV3/Ad group and the PIV3/Ad/HBD6 group (P = 0.08) had increased respiration rates compared to those for the animals in PIV3 group. Starting on day 4 the animals in the PIV3-infected groups had increased respiration rates compared to those of the control animals, with that for the animals in the PIV3/Ad/HBD6 group being slightly higher on days 6 and 7. *, P < 0.05 compared with the results for the controls; **, P < 0.05 compared with the results for the PIV3 group.

