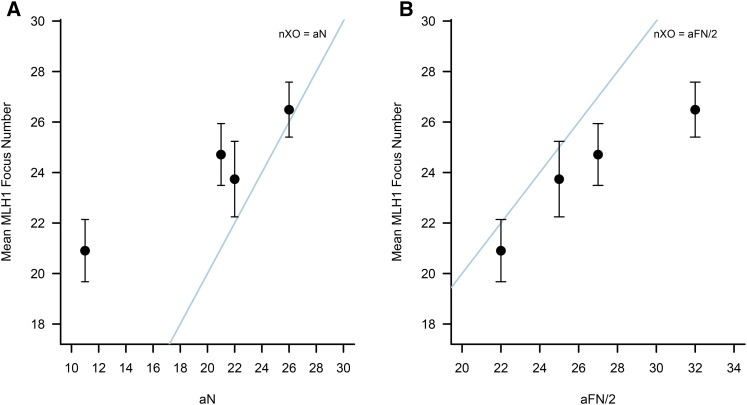
Figure 4.
Distribution of mean (± 1 SD) MLH1 foci counts in male voles as a function of (A) the number of autosomes in a haploid genome and (B) the haploid number of autosomal chromosome arms. From left to right on both plots, points correspond to species values for M. montanus, M. mogollonensis, M. pennsylvanicus, and M. ochrogaster. (A) All species harbor more crossovers than autosomal bivalents, as demonstrated by the fact that all points fall above the y = x line corresponding to one crossover per chromosome. (B) In contrast, none of the examined vole species has, on average, more crossovers than chromosome arms, with all points falling below the nXO = aFN line.

