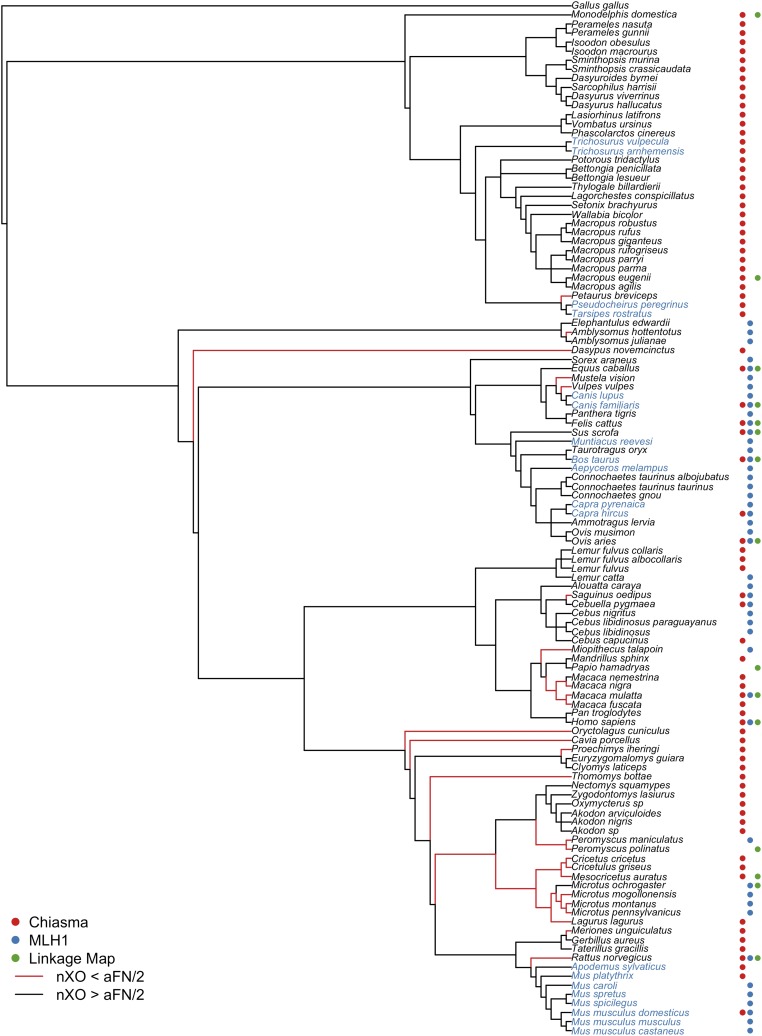
Figure 5.
The phylogenetic distribution of the meiotic constraint on crossing over in mammals. An informal supertree was assembled to depict the evolutionary relationships among taxa for which crossover frequency estimates are available. Note that branch lengths on this cladogram are not proportional to evolutionary divergence and represent only the relations among taxa. Poorly resolved species relationships are represented as polytomies. The column to the right of each species name denotes whether available recombination estimates for that species derive from analysis of chiasma counts (red dot), MLH1 foci counts (blue dot), or genetic linkage maps (green dot). Lineages leading to species with fewer crossovers than chromosome arms are shown in red. The names of species with karyotypes composed of only acrocentric chromosomes are shown in blue.

