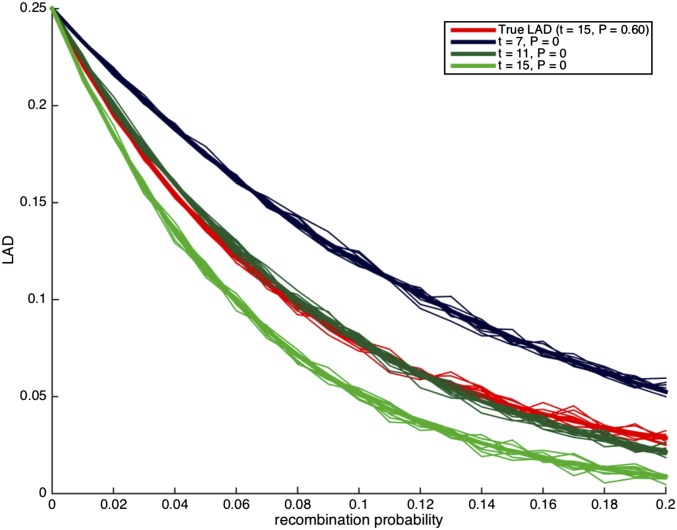
Figure 4.
Demonstrating the effect of a random mating assumption when truly All curves correspond to scenarios with no migrations. The thick lines correspond to the expected local ancestry linkage disequilibrium (LAD) based on Lemma 3.1, and the thin lines correspond to simulation runs of a single locus in the genome.

