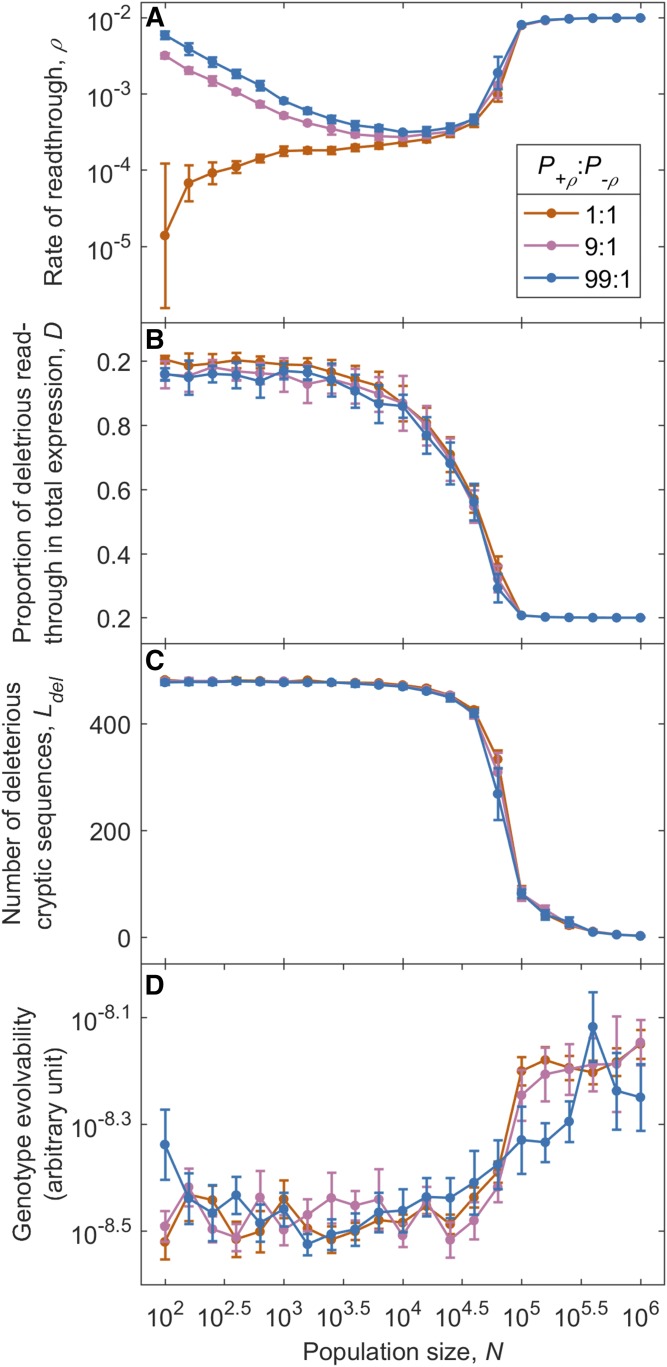
Figure 4.
Mutation bias tends to increase ρ, such that even the global solution breaks down in sufficiently small populations. P+ρ is the probability that a mutation increases ρ, and P−ρ is the probability of a decrease. Each data point, (except those taken from Figure 1 with P+ρ:P−ρ = 1:1 and N = 103.6–106.0), is pooled from five replicates of high-ρ initial conditions and five replicates of low-ρ initial conditions. Because we assume multiplicative mutational effects to ρ, its value converges even for extremely small N. i.e., as ρ increases, the additive effect size Δρ of a typical mutation also increases, preventing it from passing through the drift barrier. For (A–C), data are shown as mean SD. For (D), data are shown as mean SE. For (A) and (D), these apply to log-transformed values. L = 600 and σE = 2.25.

