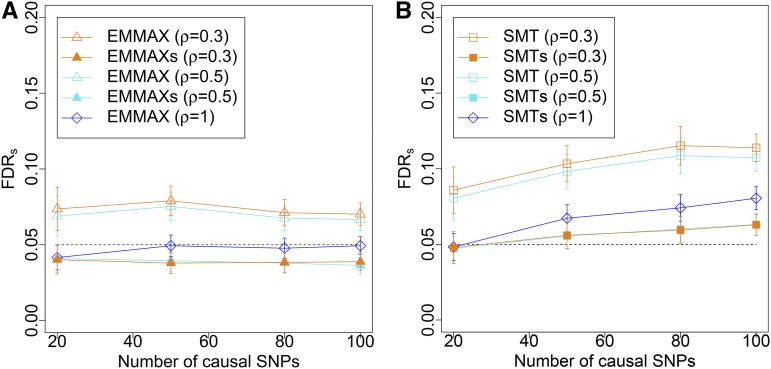
Figure 3.
FDRs for the described procedures: in (A) we report results relative to EMMAX and in (B) relative to SMT. The dashed black line represents the target FDRs level of 0.05. Note that EMMAXs with (i.e., with no clustering) coincides with EMMAX, and that the FDRs for this specific case corresponds to the regular FDR. Shapes indicate the procedures: empty triangles for the application of BH to the collection of P-values from EMMAX for all hypotheses followed by clustering of the discoveries; filled triangles for the selective procedure EMMAXs; empty squares for the application of BH to the collection of P-values from SMTs for all hypotheses followed by clustering of the discoveries; filled squares for the selective procedure SMTs; and empty diamonds for the application of BH to the full collection of P-values with no clustering. Colors indicate the parameters for clustering: orange for turquoise for and blue for

