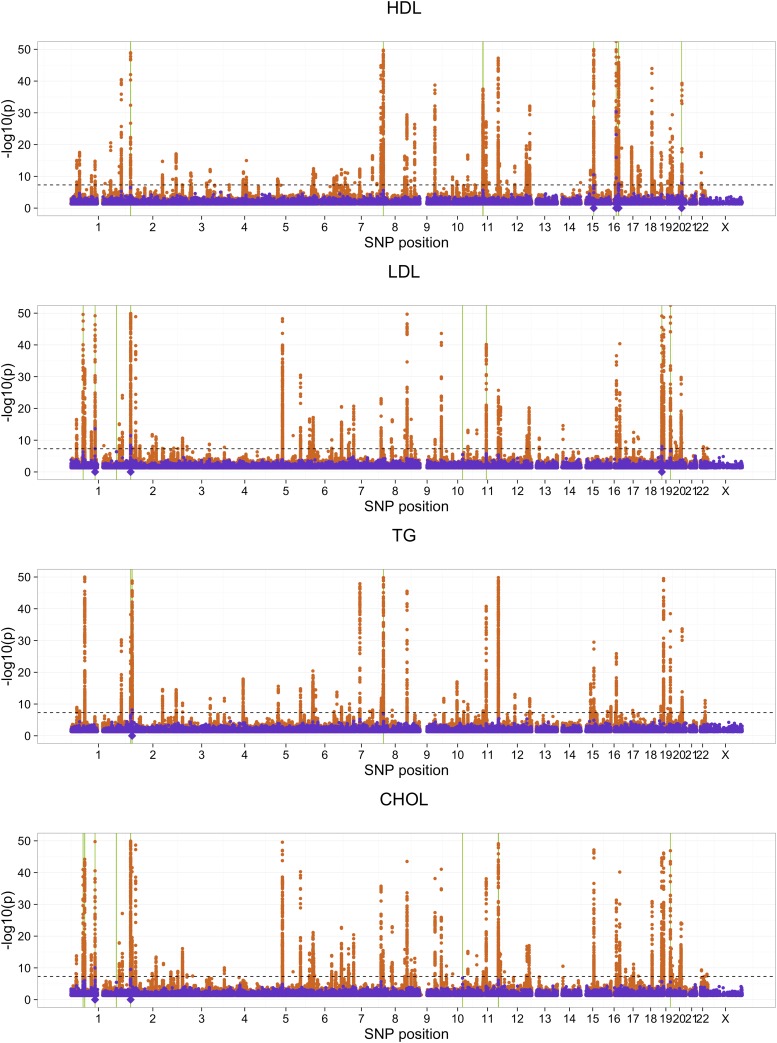
Figure 6.
Localization of lipid signals. GeneSLOPE selections using ρ = 0.5, and target FDRs 0.1 are marked using solid green bars for cluster representatives and semitransparent bars for the remaining members of the cluster. P-values from EMMAX (purple) and the Global Lipids Genetics Consortium comparison study (orange) are plotted on the −log10 scale. The horizontal dashed line marks a significance cut off of 5 × 10⁻⁸, and the purple diamonds below the x-axis represents selected cluster representatives under EMMAX using and a P-value threshold of 5 × 10⁻⁸.

