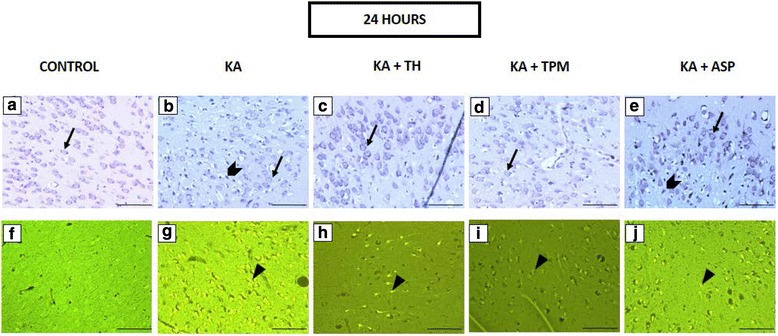
Fig. 2.

In the photomicrographs, representative image of cresyl violet staining (a–e) and FJC staining (f–j) in the piriform cortex after 24 h of KA challenge were presented. Arrows indicate the viable cell under cresyl violet staining (a–e). In KA- treated groups and ASP+ KA treated groups, neurons appeared pyknotic, indicated by chevron (b and b). Neuronal degeneration, indicated by arrowheads, was detected after 24 h of KA administration in the piriform cortex (g–j). Scale bars: 100 μm. Magnification: 200x magnification
