
Fig. 1.
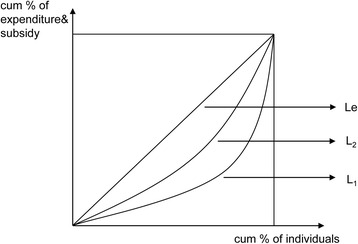
Conceptual concentration curve for government subsidies on healthcare and income. The figure displays the conceptual concentration curve for government subsidies on healthcare and per capita income. The concentration curve plots the cumulative percentage of health subsidy (y-axis) against the cumulative percentage of the population (x-axis), ranked by living standard from the poorest to the richest. It is measured by CI, as twice the area between the concentration curve, L1, and the line of equality (the 45° line running from the bottom-left corner to the top-right, Le). The Lorenz curve (L2) represents the relationship between the cumulative percentage of per capita income and the cumulative percentage of the population, which is measured by the Gini coefficient