
Fig. 3.
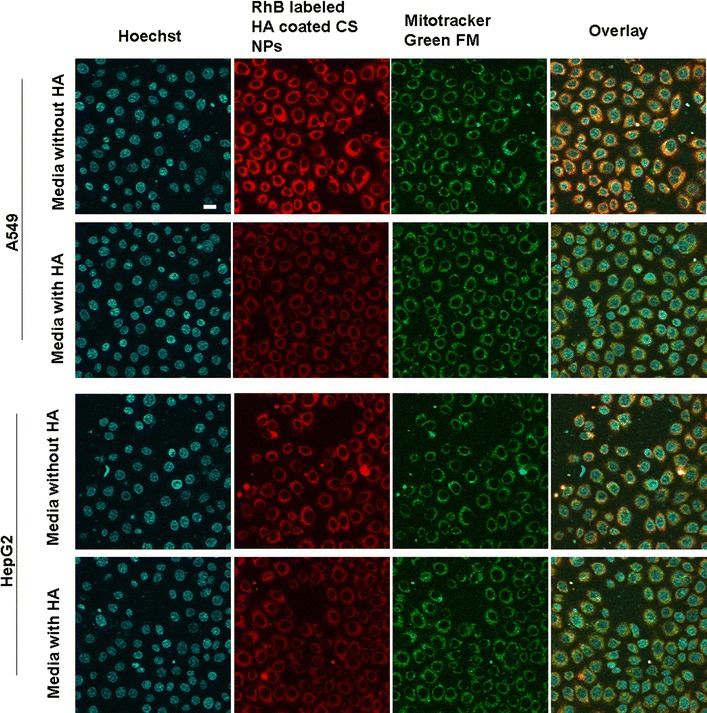
The in vitro cellular distribution of RhB-labeled HA-coated CS NPs following the incubation of A549 cells and HepG2 cells. The scale bar in all figure parts is 100 μm
Official websites use .gov
A
.gov website belongs to an official
government organization in the United States.
Secure .gov websites use HTTPS
A lock (
) or https:// means you've safely
connected to the .gov website. Share sensitive
information only on official, secure websites.
The in vitro cellular distribution of RhB-labeled HA-coated CS NPs following the incubation of A549 cells and HepG2 cells. The scale bar in all figure parts is 100 μm