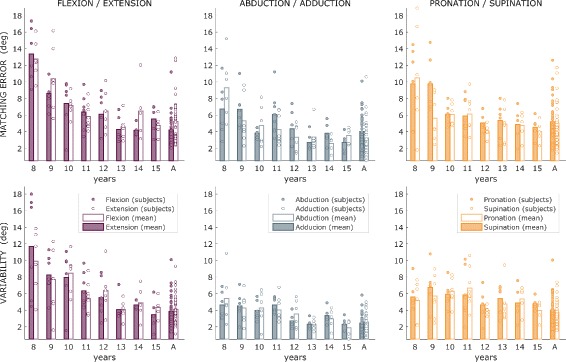
Fig. 4.

Analysis of raw data. Raw values for each participant (represented with dots) of Matching Error (top panels) and Variability for the three DoFs and their two directions (filled dots for one direction, empty dots for the opposite one). Colored or empty bars indicate mean value across subjects of Matching Error (top panels) and Variability in the two direction of the three DoFs
