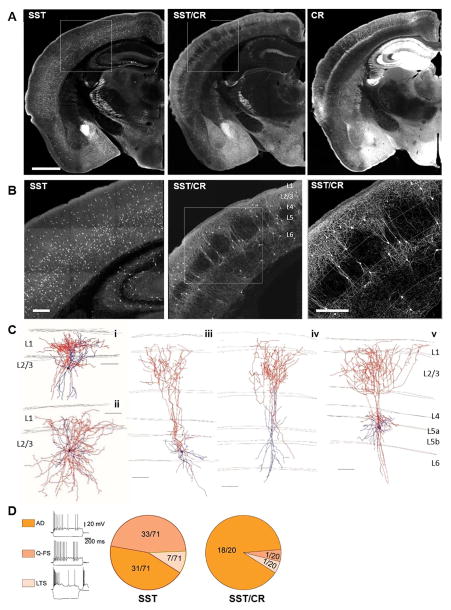
Figure 4. Intersectional targeting of the SST/CR subpopulation.
(A) SST-Flp;tdTomato-FRT, (SST) SST-Flp;CR-Cre;Ai65 (SST/CR) and CR-Cre;Ai14(CR) mice show distinct cell distributions in numerous brain areas. (B) Higher magnification images of boxed area in (A) highlight laminar difference between SST and SST/CR cells. (C) Neurolucida reconstruction of biocytin filled L2/3 (i, ii) and L5 (iii-v) neurons with Martinotti type morphology. Axons were traced in red and dendrites in blue. (D) More homogenous firing patterns were seen in SST/CR than in SST cells. AD: adapting firing pattern, characterized by a strong firing frequency adaptation, and triphasic afterhyperpolarization following single spikes. Q-FS: “quasi” fast spiking, characterized by low input resistance (≤200 MΩ), stuttering firing pattern, ability to sustain high firing frequencies, and deep and short duration afterhyperpolarizations. LTS: low-threshold spiking characterized by high input resistance (> 400 MΩ), rebound bursting in response to hyperpolarizing current steps, and low-threshold bursting in response to depolarizing current steps from hyperpolarized potentials. Scale bar in (A): 1mm. Scale bar in (B): 250μm. Scale bar in (C), (D): 100μm. (See also Figure S5, Table S2–5.)

