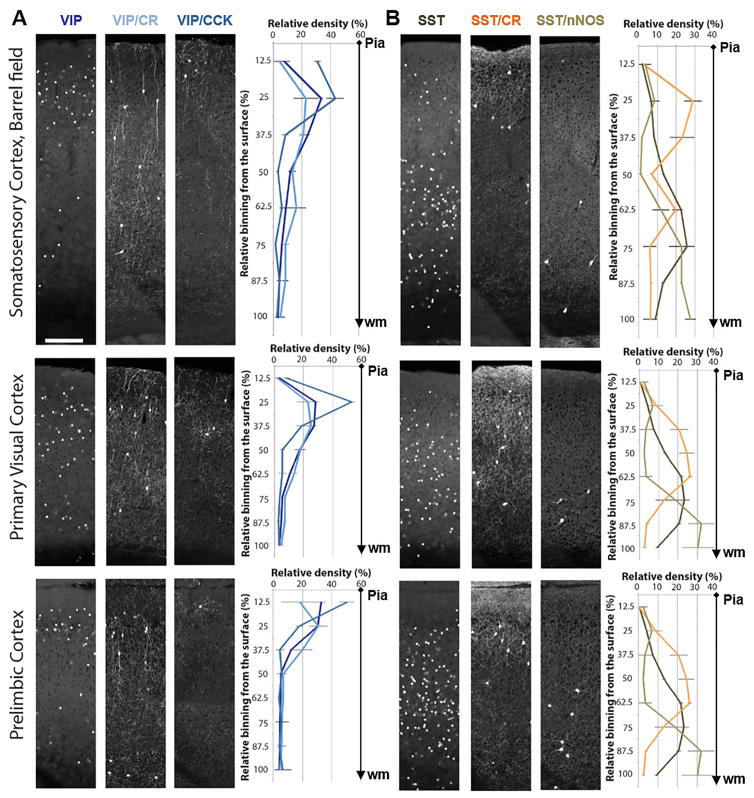
Figure 6. Laminar distribution pattern of GABAergic subpopulations in barrel, primary visual and prelimbic cortices.
(A) Laminar distribution of VIP neurons and their two subpopulations VIP/CR and VIP/CCK. (B) Laminar distribution of SST neurons and their two subpopulations SST/CR and SST/nNOS. VIP and SST neurons are labeled by a Cre activated H2B-GFP reporter (LSL-HG), while intersectional lines are labeled by a Cre and Flp activated tdTomato reporter (Ai65). Data points: mean ± standard deviation (see Table S5 for actual numbers). N = 4 in VIP, VIP/CR, SST, SST/CR. N=3 in VIP/CCK and SST/nNOS. Scale bar: 200μm. (See also Table S5.)

