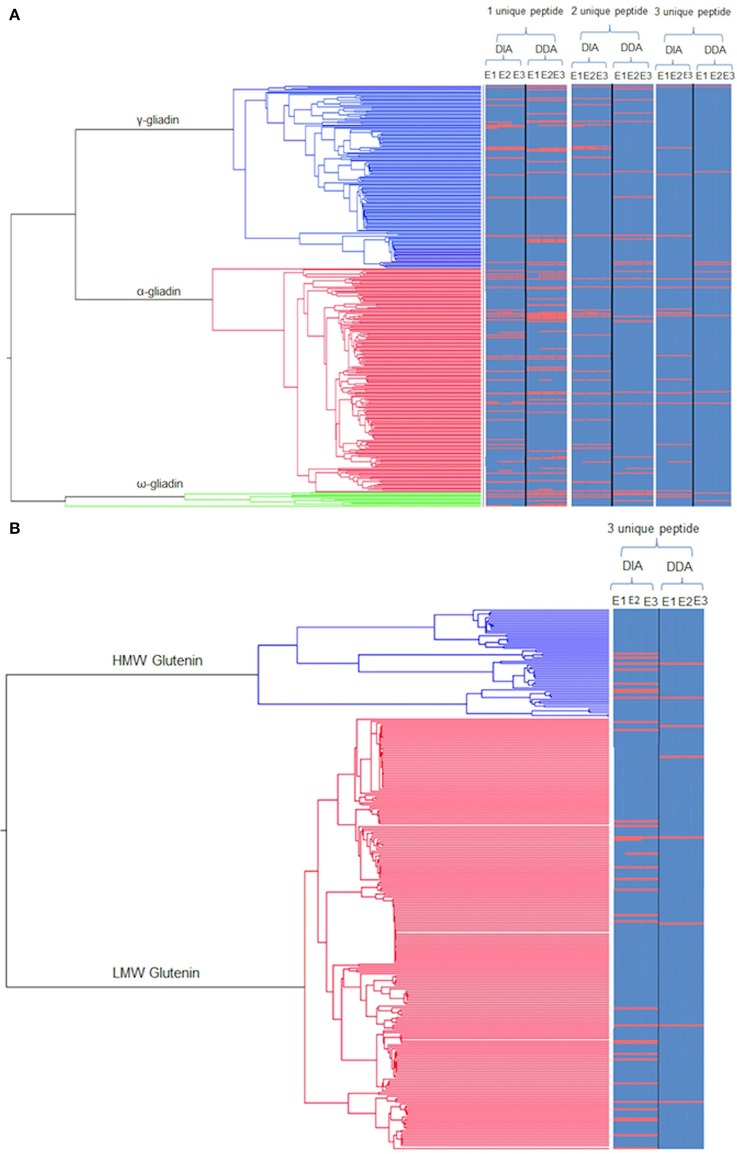
Figure 2.
Phylogenetic trees of gluten protein sequences mapped with identifications from the different extracts using the different platforms. (A) Phylogenetic tree of the monomeric gliadins (α-gliadin: red, γ-gliadins: blue; and ω-gliadins: green) linked to a heat map showing the protein identifications as a red line for each extract (E1–3) as a function of the minimum number of unique peptides per protein across the two modes of acquisition (DIA, DDA). Protein accessions identified by DIA and DDA are indicated denoted by a continuous red line, with an off-set red line indicating closely related, but distinct isoforms, identified by only one MS platform. (B) Phylogenetic tree of the polymer (glutenin) gluten proteins (HMW: Blue and LMW: Red) linked to a heat map as for (A) but only showing the protein identifications made using a minimum three unique peptides per protein.

