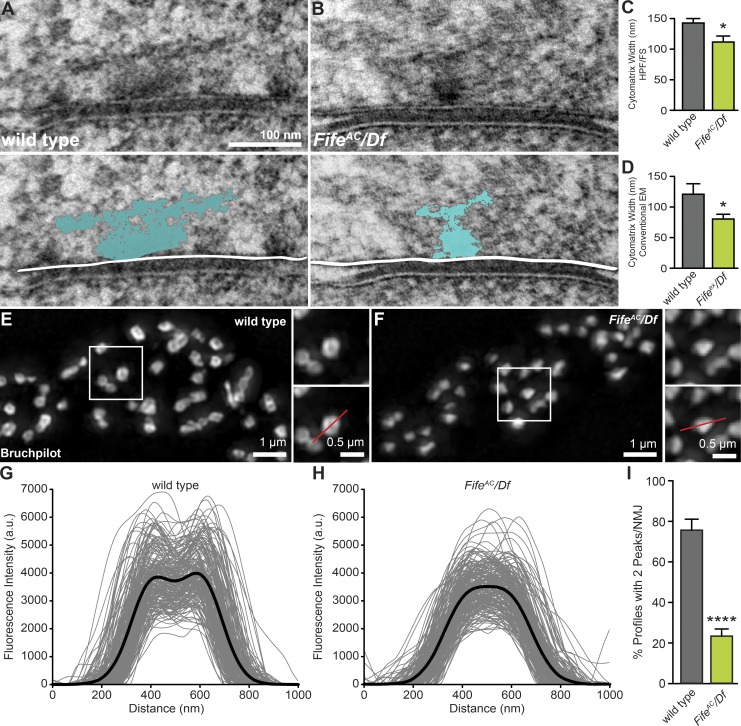
Figure 3.
Fife regulates active zone size and molecular organization. (A–D) Reduced active zone cytomatrix size in electron micrographs of ultrathin sections of wild-type (A) and Fife (B) NMJs. The width of the cytomatrix (blue) in samples prepared using HPF/FS techniques (A–C) is significantly reduced in FifeAC/Df (111.0 ± 9.6 nm, n = 31 cytomatrices) compared with wild type (141.9 ± 7.3 nm, n = 46 cytomatrices, P = 0.011). A similar reduction is observed between Fifeex/Df (80.4 ± 7.8 nm, n = 17 cytomatrices) and wild-type (121.0 ± 17.1 nm, n = 13 cytomatrices, P = 0.046) cytomatrices in aldehyde-fixed samples (D). (E and F) SIM images of wild-type (E) and FifeAC/Df (F) NMJs stained with nc82 anti-Bruchpilot antibody. Insets in E and F show representative Bruchpilot punctae and an example line scan used to generate intensity profiles (red line). (G and H) Fluorescence intensity profiles along a line bisecting individual Bruchpilot punctae (gray lines) and the mean intensity profiles (black lines) are shown for wild type (G, n = 198 active zones) and FifeAC/Df (H, n = 200 active zones). (I) Quantification of the percentage of plot profiles with two peaks per wild type (75.7 ± 5.4%, n = 10 NMJs [198 active zones]) and FifeAC/Df (23.4 ± 3.5%, n = 10 NMJs [200 active zones]; P < 0.0001) NMJ. *, P < 0.05, ****, P < 0.0001, Student’s t test. Error bars represent SEM.

