Figure 7.
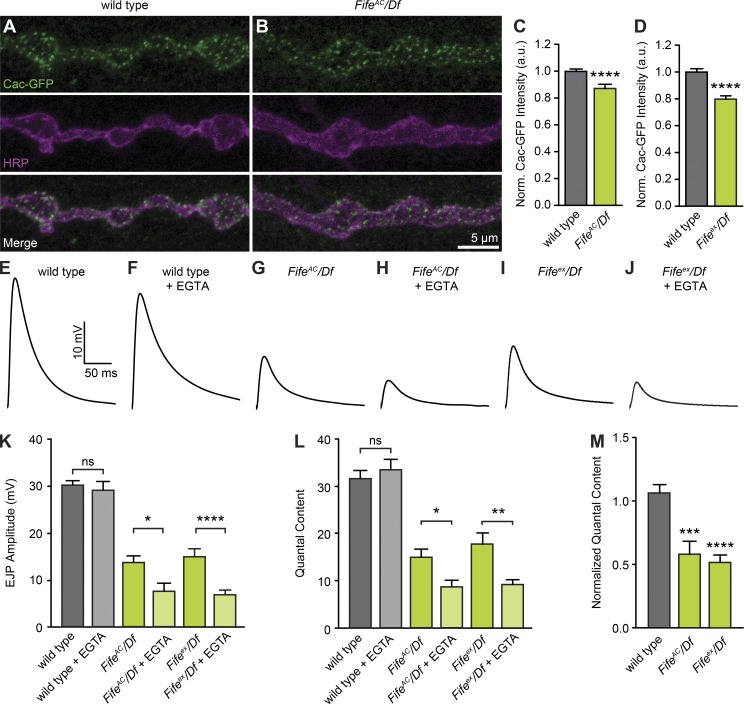
Fife promotes synaptic vesicle-Ca2+ channel coupling. (A and B) Confocal z-projections of Cacophony (Cac)-GFP localization at wild-type (A, OK6 Gal4/+; UAS-Cac-GFP/+) and Fife (B, OK6 Gal4, UAS-Cac-GFP/+; FifeAC/Df) NMJs colabeled with antibodies to GFP and HRP. (C and D) Cac-GFP fluorescence intensity normalized to HRP fluorescence intensity is reduced in FifeAC/Df (C, 0.87 ± 0.03 a.u., n = 24 NMJs) compared with wild type (1.0 ± 0.02 a.u., n = 27 NMJs, P < 0.0001), and similarly in Fifeex/Df (D, 0.80 ± 0.02 a.u., n = 20 NMJs) compared with wild type (1.0 ± 0.02 a.u., n = 21 NMJs, P < 0.0001). (E–J) Representative traces of EJPs in wild type (E and F), FifeAC/Df (G and H), and Fifeex/Df (I and J) in the absence of EGTA-AM (E, G, and I) and with 10 min pretreatment in 100 µM EGTA-AM (F, H, and J) recorded in HL3 containing 0.6 mM [Ca2+]e. (K and L) Mean EJP amplitude (K) and quantal content (L) are unaffected by exposure to EGTA-AM in wild type (P = 0.60 and 0.47, respectively) but significantly affected in FifeAC/Df (P = 0.010 and 0.015, respectively) and Fifeex/Df (P < 0.0001 and P = 0.004, respectively). (M) Quantal content of EGTA-treated NMJs normalized to untreated controls reveals a significant difference in sensitivity to EGTA between FifeAC/Df and Fifeex/Df and wild type (P = 0.0002 and P < 0.0001, respectively). Wild type: EJP amplitude, 30.16 ± 1.04 mV; quantal content, 31.57 ± 1.68; n = 16 NMJs; wild type + EGTA: EJP amplitude, 29.08 ± 1.96 mV; quantal content, 33.53 ± 2.12; n = 12 NMJs; FifeAC/Df: EJP amplitude, 13.79 ± 1.42 mV; quantal content, 14.99 ± 1.70; n = 16 NMJs; FifeAC/Df + EGTA: EJP amplitude, 7.66 ± 1.67 mV; quantal content, 8.66 ± 1.53; n = 11 NMJs; Fifeex/Df: EJP amplitude, 14.91 ± 1.71 mV; quantal content, 17.82 ± 2.36; n = 12 NMJs; and Fifeex/Df + EGTA: EJP amplitude, 6.844 ± 0.99 mV; quantal content, 9.17 ± 1.04; n = 16 NMJs. ns, not significant; *, P < 0.05; **, P < 0.01; ***, P < 0.001; ****, P < 0.0001, Student’s t test or, for non–normally distributed samples, Mann–Whitney U test for single comparisons, analysis of variance followed by post hoc tests with Šidák correction for multiple comparisons. Error bars represent SEM.

