Figure 1.
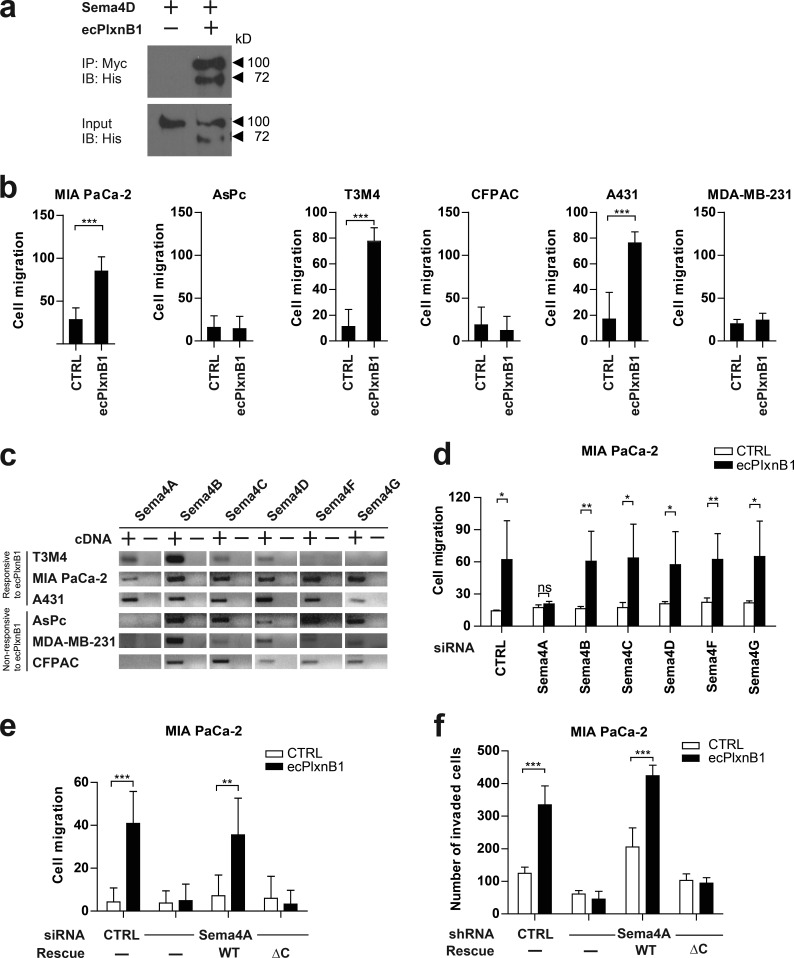
Plexin-B1 promotes cancer cell migration and invasion through its receptor Sema4A. (a) A purified His-Myc–tagged extracellular portion of Plexin-B1 (ecPlxnB1; amino acids 20–534 of human Plexin-B1) and His-tagged Sema4D were mixed in equimolar concentrations and incubated in the presence of anti-Myc antibodies. Protein complexes were then precipitated using protein A/G agarose. Proteins were immunoblotted and visualized using an anti-His antibody. IB, immunoblotting; IP, immunoprecipitation. (b) MIA PaCa-2, AsPc, T3M4, CFPAC, A431, or MDA-MB-231 cells were seeded onto 96-transwell migration plates in the absence or presence of 150 nM ecPlxnB1, and cell migration was analyzed as described in Materials and methods. Shown are mean values ± SD from duplicates of three independent experiments (total n = 6 per condition). CTRL, control. (c) Expression analysis of class 4 semaphorins in cancer cell lines by RT-PCR. (d) MIA PaCa-2 cells were transfected with control or siRNA directed against Sema4A, B, C, D, F, or G (as indicated). Cell migration in the absence or presence of 150 nM ecPlxnB1 was tested using a transwell system as described in Materials and methods. Shown are mean values ± SD of three independent experiments (total n = 5 per condition). ns, not significant. (e) MIA PaCa-2 cells were transfected with control or Sema4A siRNA. After 48 h, cells were transfected with cDNA encoding siRNA-resistant wild-type or mutant Sema4A lacking the intracellular part. Cell migration was tested using a transwell system. Shown are mean values ± SD from duplicates of three independent experiments (total n = 6 per condition). (f) MIA PaCa-2 cells were stably transfected with either control shRNA or shRNA against Sema4A. Where indicated, cells were additionally transfected with cDNA encoding shRNA-resistant wild-type Sema4A (WT) or shRNA-resistant Sema4A lacking its intracellular portion (∆C). Cells were seeded onto Matrigel-coated filters (total n = 6 per condition). Invaded cells were stained and counted. Error bars represent means ± SD. *, P < 0.05; **, P < 0.01; ***, P < 0.001.

