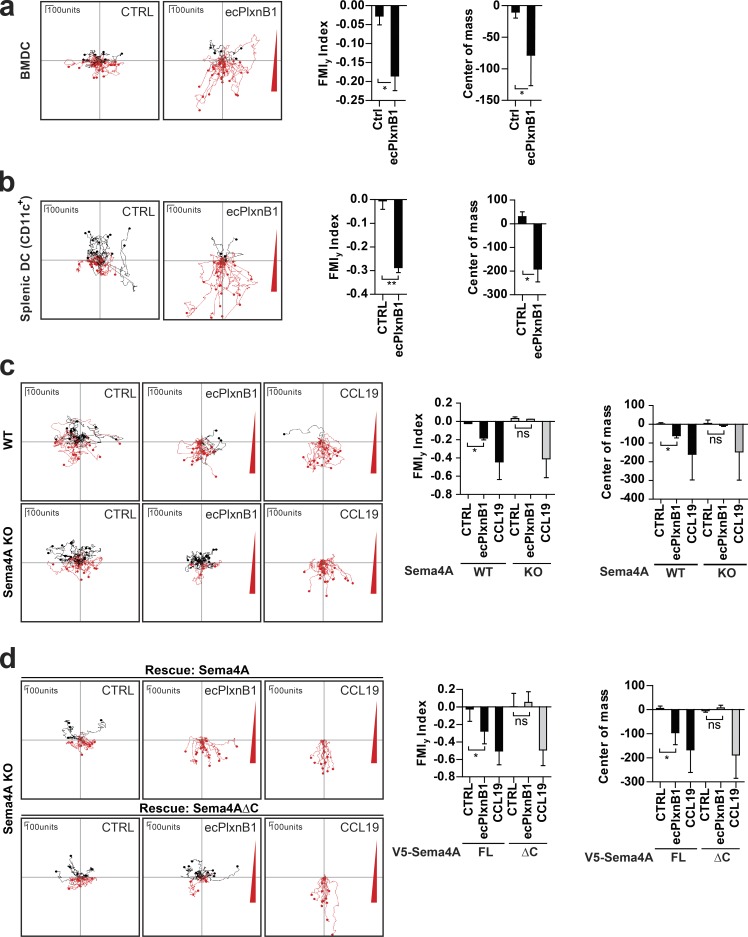
Figure 2.
Plexin-B1–Sema4A reverse signaling regulates DC migration in vitro. (a–d) The migratory behavior of mature BMDCs (a, c, and d) or splenic DCs (b) exposed to control buffer (CTRL), to a gradient of ecPlxnB1, or to a gradient of CCL19 was analyzed as described in Materials and methods. Gradients are indicated by a red triangle at the right side of the depicted plots. Each line represents a track of an individual cell. Cell tracks with an endpoint in the top half of the plot (i.e., on the side of the lower agonist concentration) are labeled in black, and cell tracks with an endpoint in the bottom half of the plot (i.e., on the side of the higher agonist concentration) are labeled in red. (c) Mature BMDCs generated from wild-type (WT) or Sema4A knockout (KO) mice were examined. ns, not significant. (d) BMDCs isolated from Sema4A knockout mice were infected with lentiviruses carrying full-length wild-type Sema4A (V5-Sema4A FL) or Sema4A lacking the intracellular part (V5-Sema4AΔC). After maturation, cell migration was analyzed. FMIy, y-forward migration index. Total numbers of analyzed cells are CTRL, n = 57 and ecPlxnB1, n = 51 (a); CTRL, n = 32 and ecPlxnB1, n = 60 (b); WT/CTRL, n = 47; WT/ecPlxnB1, n = 38; WT/CCL19, n = 43; KO/CTRL, n = 36; KO/ecPlxnB1, n = 30; and KO/CCL19, n = 40 (c); and FL/CTRL, n = 26; FL/ecPlxnB1, n = 34; FL/CCL19, n = 25; ΔC/CTRL, n = 26; ΔC/ecPlxnB1, n = 33; and ΔC/CCL19, n = 31 (d). Error bars represent means ± SD. *, P < 0.05; **, P < 0.01.

