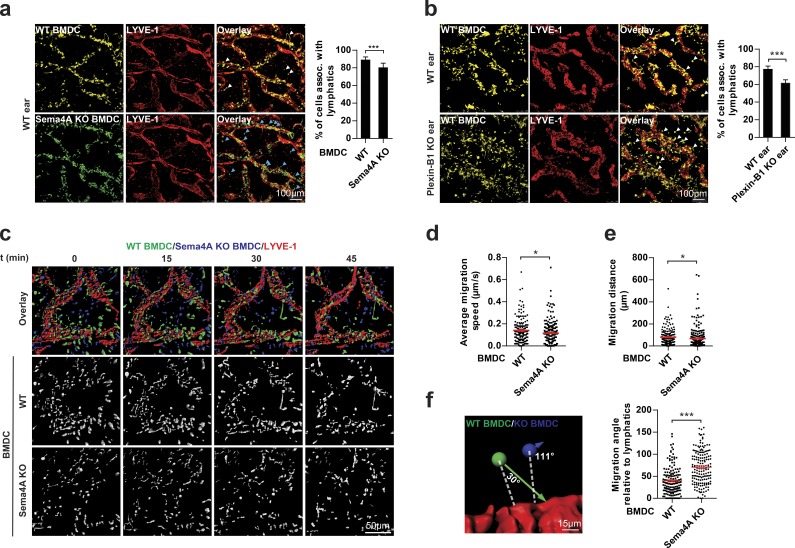
Figure 3.
Plexin-B1 and Sema4A regulate DC migration ex vivo. (a) Mature BMDCs generated from wild-type (WT) and Sema4A knockout mice (Sema4A KO) were fluorescently labeled (WT, yellow; Sema4A KO, green), mixed 1:1, and used for the ex vivo migration assay (right). After 1.5 h, BMDCs associated with lymphatic vessels were quantified (left). Examples of wild-type (white arrows) and Sema4A-knockout (blue arrows) BMDCs not associated with lymphatic vessels are marked. (b) Mature BMDCs generated from wild-type mice were allowed to migrate into ear sheets of wild-type or Plexin-B1 knockout mice for 1.5 h (right). BMDCs associated with lymphatic vessels were quantified (left). Examples of BMDCs not associated with lymphatic vessels are marked with white arrows. (c) Mature BMDCs generated from wild-type and Sema4A knockout mice were fluorescently labeled (WT, green; Sema4A KO, blue), mixed 1:1, and used for live-cell imaging (different time points shown). (d and e) Quantification of migration speed (d) and distance (e) of BMDCs with the indicated genotypes. (f) Analysis of the migration angle of BMDCs relative to the lymphatic vessel. Dashed white lines represent the shortest possible distance to lymphatic vessels. Red horizontal lines indicate means ± SEM. Colored arrows represent vectors of BMDC migration. Bar graphs in a and b show mean values ± SD from three independent experiments. Graphs in d–f are based on six independent experiments. Total numbers of analyzed cells are WT, n = 1,993 and Sema4A KO, n = 1,785 (a); WT ear, n = 1,786 and Plexin-B1 KO ear, n = 1,560 (b); WT, n = 172 and Sema4A KO, n = 239 (d and e); and WT, n = 157 and Sema4A KO, n = 164 (f). Error bars represent means ± SD (a and b) or SEM (d–f). *, P < 0.05; ***, P < 0.001.

