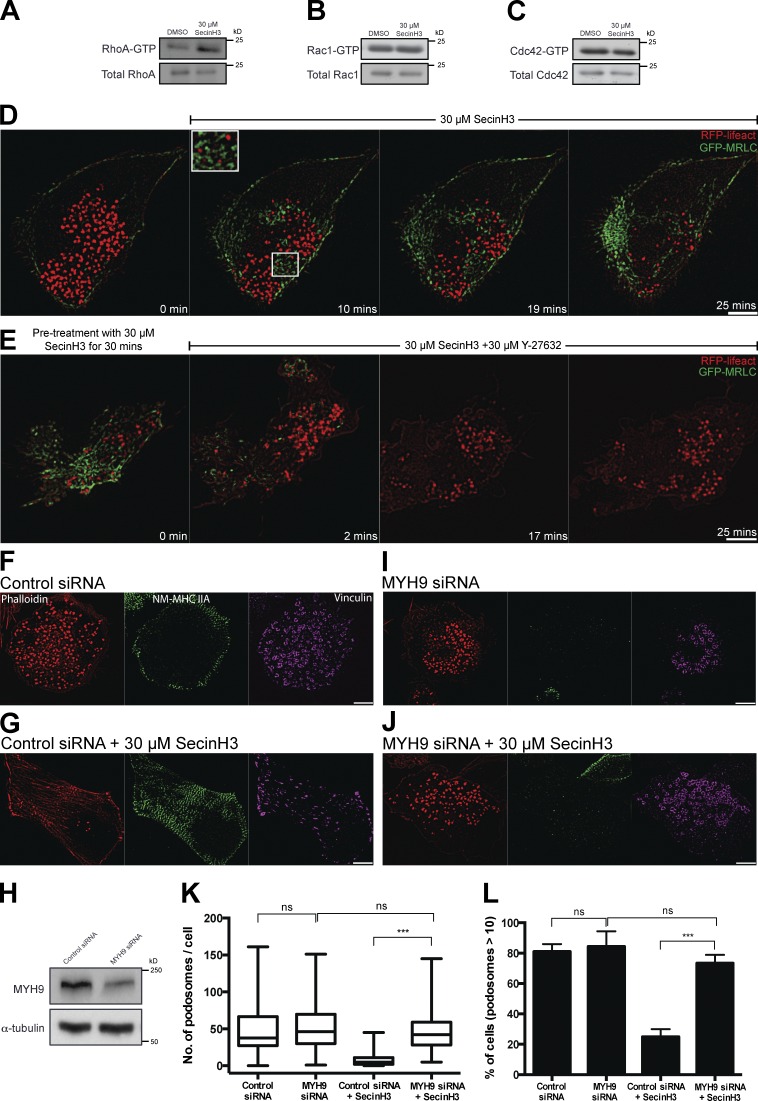
Figure 6.
Inhibition of ARF1 activity induces RhoA activation. (A–C) 1-h incubation of TGFβ1-stimulated THP1 cells with 30 µM SecinH3 led to increase in RhoA-GTP (A) but not Rac1-GTP (B) or Cdc42-GTP (C) fractions as indicated by Western blots after pull-down assay. (D–J) SIM visualization of podosome dynamics in TGFβ1-stimulated THP1. (D and E) Live imaging of cell stably transfected with GFP-MRLC to visualize myosin-II filaments and RFP-Lifeact to visualize podosome cores. (D) Cell treated with 30 µM SecinH3 shows an increase in myosin-IIA filament assembly (green) and disruption of podosomes (red). Enlarged image of white-boxed area (5 × 4.5 µm2) of D shows colocalization between appearance of myosin-IIA filaments and podosome disruption (see Video 7). (E) Time course of podosome reappearance after addition of 30 µM ROCK inhibitor Y-27632 to cell incubated in SecinH3-containing medium. Note that podosomes (red) appeared after disassembly of myosin-II filaments (green). (F–J) TGFβ1-stimulated THP1 cells were transfected with either control scrambled siRNA (F and G) or with siRNA to NM-myosin-IIA heavy chain, MYH9 (I and J) and, after 48 h, treated with either 0.1% DMSO (F and I) or 30 µM SecinH3 (G and J) for 1 h. (F, G, I, and J) After fixation, the cells were stained with phalloidin (left) and antibodies to NM-myosin-IIA heavy chain (middle) and vinculin (right). Bars, 5 µm. (H) Western blot showing protein levels of NM-myosin-IIA heavy chain in control cells (transfected with scrambled siRNA) or in NM-myosin-IIA knockdown cells (transfected with MYH9 siRNA); α-tubulin was used as a loading control. (K and L) Effect of SecinH3 treatment of control and NM-myosin-IIA knockdown cells on number of podosomes per cell (K) and percentage of cells with more than 10 podosomes (L). The data in K and L are presented as indicated in the legend to Fig. 1. Pooled data of at least two independent experiments are presented for each group. The significance of the difference between groups was estimated by two-tailed Student’s t test. nonsignificant (ns), P > 0.05; ***, P ≤ 0.001.

