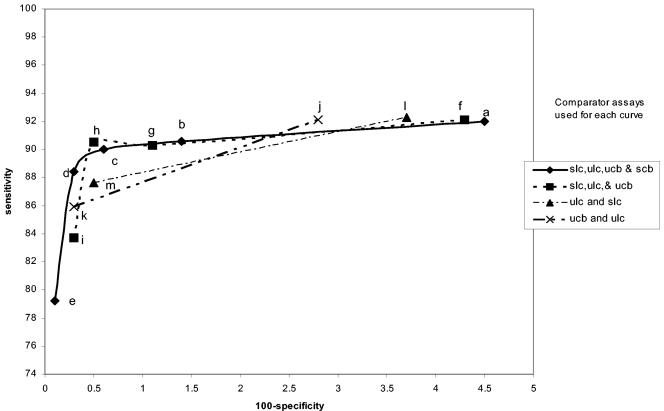
FIG. 7.
Amplicor male urine specimen performance curves. The legend to the right shows which specimens and assays were used as comparators for each curve. sam, swab by Amplicor; uam, urine by Amplicor; slc, swab by LCx; ulc, urine by LCx; scb, swab by Combo 2; ucb, urine by Combo 2. The individual points in each curve were determined as described in Table 1. The letters refer to the specific infected-patient definitions used to calculate each point on the curves as detailed in Table 1.

