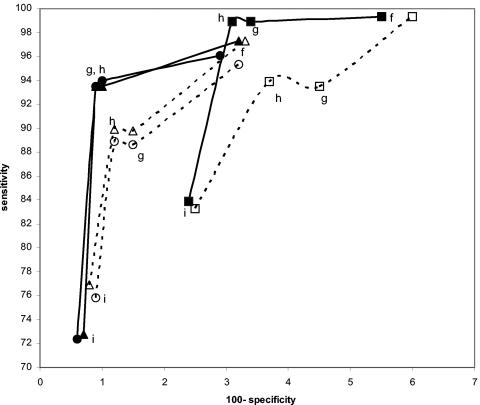
FIG.8.
Effect on performance estimates for swab specimens of varying the definition of the infected patient by changing the mix of urine and swab specimens used as comparators. All curves were constructed with the three-comparator definitions f, g, h, and i (see Table 1). Solid lines represent data based on two swabs and one urine comparator. Dashed lines represent data based on one swab and two urine comparators. Solid square, swab by Combo 2 versus swab by LCx, urine by LCx, and swab by Amplicor; open square, swab by Combo 2 versus swab by LCx, urine by LCx, and urine by Amplicor; solid circle, swab by LCx versus swab by Amplicor, urine by Amplicor, and swab by Combo 2; open circle, swab by LCx versus swab by Amplicor, urine by Amplicor, and urine by Combo 2; solid triangle, swab by Amplicor versus swab by LCx, urine by LCx, and swab by Combo 2; open triangle, swab by Amplicor versus swab by LCx, urine by LCx, and urine by Combo 2.

