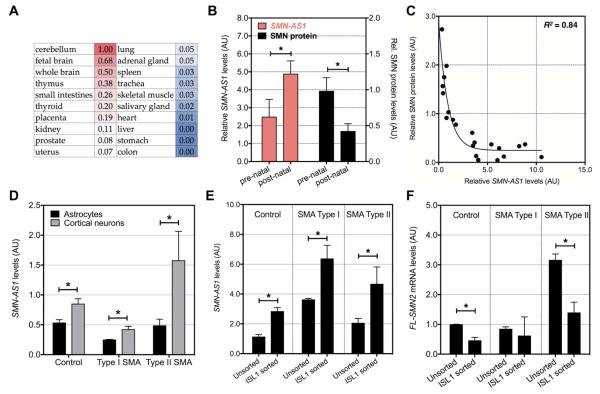
Figure 2. SMN-AS1 expression in neuronal tissues and neurons.
(A) Heat map indicating relative SMN-AS1 levels in 20 different human tissues. (B) SMN-AS1 and SMN protein levels measured in human thoracic spinal cords at prenatal (n=12; age: 15 to 35 weeks of gestation) and postnatal (n=10; age: 1 day to 1 year) stages. Mean + SEM, * P < 0.05. (C) One-phase decay model indicating an inverse correlation (R2 = 0.84) between SMN-AS1 and SMN protein levels in human thoracic spinal cords. (D) SMN-AS1 levels in astrocytes and cortical neurons differentiated from human control and type I or type II SMA individuals. n = 3, mean + SEM, * P < 0.05. (E,F) SMN-AS1 levels (E) and FL-SMN2 mRNA levels (F) in mixed motor neuron cultures and sorted ISL1-positive motor neurons derived from human control and type I or type II SMA individuals. n = 3, mean + SEM, * P < 0.05.

