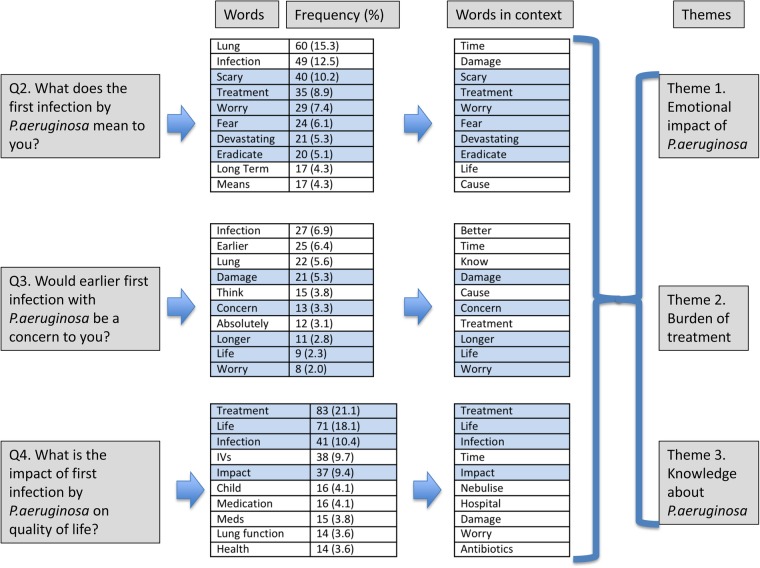
Figure 2.
Flow diagram of qualitative analysis for research questions 2–4, showing progress through word frequency, ‘words in context’ and themes. Words retained from frequency analysis to ‘words in context’ are shaded in blue. The words in context (from questions 2–4) contributed to all of the three themes identified.

