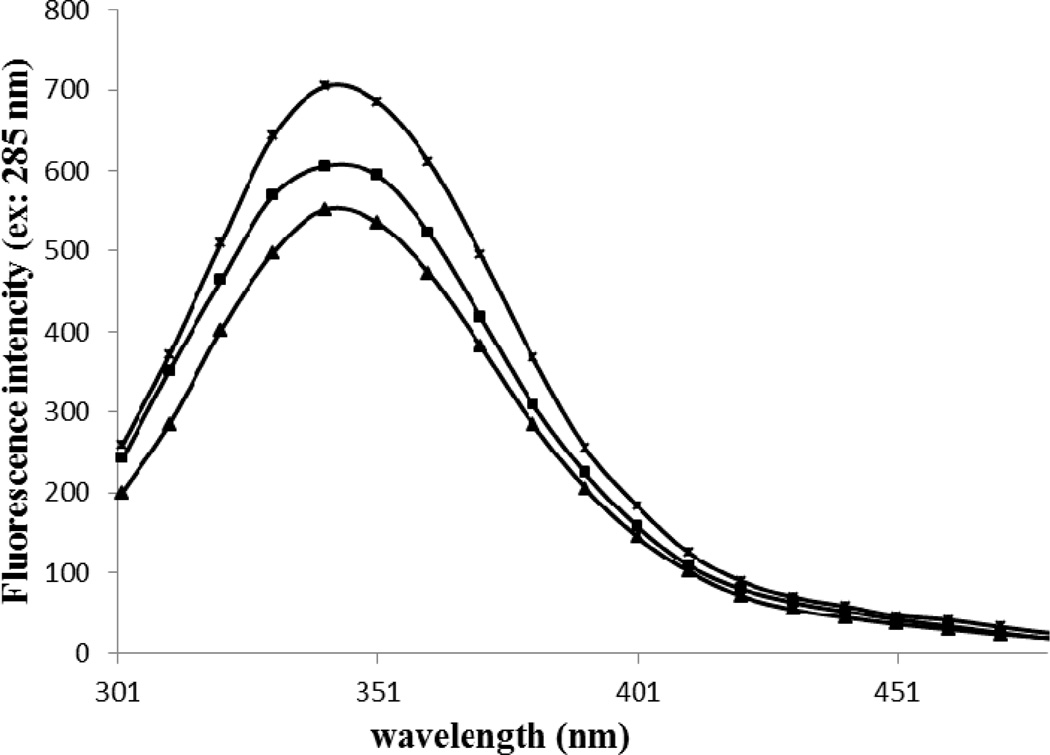
Figure 5.
Fluorescence emission spectra of HSA-control, HSA+Glc and HSA+Glc+AA at the excitation wavelength of 285 nm in 50 mM sodium phosphate buffer (pH 7.4), 1 mM EDTA and 0.1 mM sodium azide, incubated at 37 °C. The emission spectra of HSA-control ( ), HSA+Glc (
 ) and HSA+Glc+AA (
 ) are given above.

