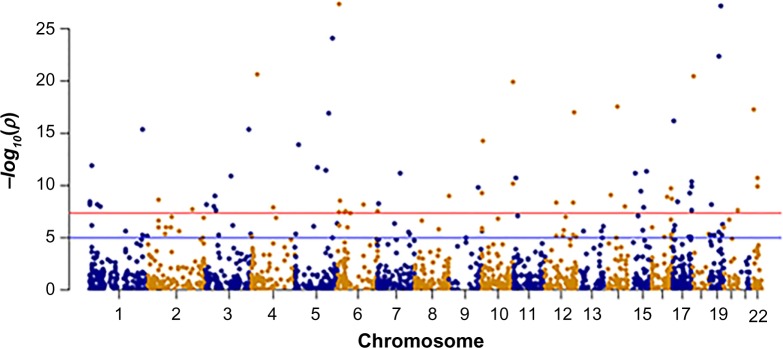
Figure 3.
Dots within the Manhattan plot display the identification of significant SNPs in the vicinity of CpG site leading to the meQTLs in the test model; the x-axis represents genomic position of SNPs, while the y-axis represents the −log P-value of the association between the SNPs and CpG sites. The red and blue lines indicate the threshold −log10(1 × 10⁻⁴) and −log10(0.05), respectively, for genome-wide statistical significance.

