Figure 9.

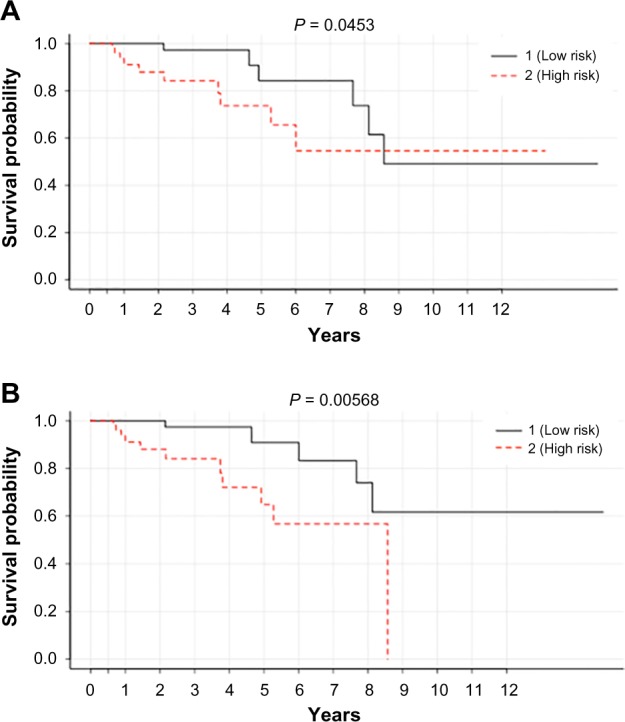
Kaplan–Meier curve associated with (A) top 16 SNPs and (B) top 9 SNPs (listed Table 3) in classifying 164 tumor patients (test set) into high- (84 patients) and low-risk (84 patients) groups at a threshold of P < 0.05.

Kaplan–Meier curve associated with (A) top 16 SNPs and (B) top 9 SNPs (listed Table 3) in classifying 164 tumor patients (test set) into high- (84 patients) and low-risk (84 patients) groups at a threshold of P < 0.05.