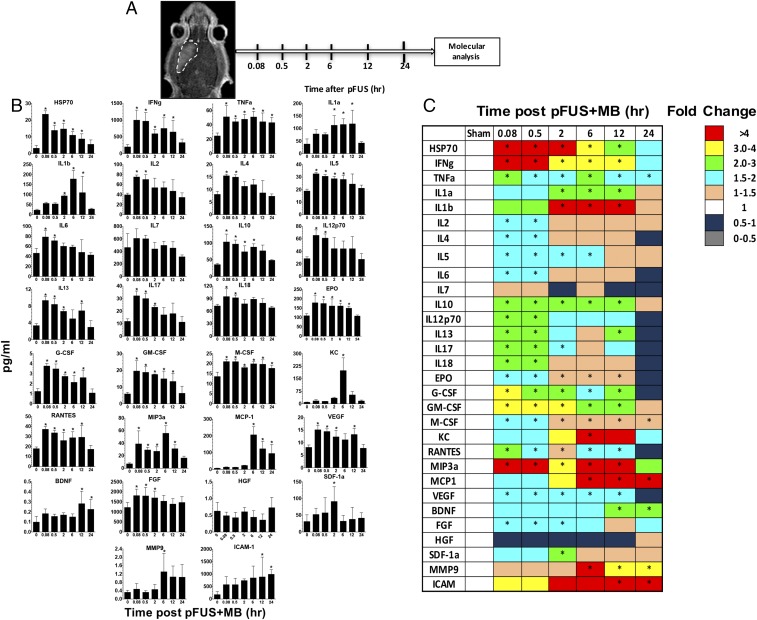
Fig. 2.
Molecular changes in the brain following pFUS+MB: pFUS+MB proteomic response in the brain. (A) Diagram of the experimental protocol. Posttreatment Gd-enhanced T1w images showing BBBD in rat left cortex and striatum. Brains from treated rats (n = 5 per time point) and from sham-treated controls (n = 5) were harvested at each time point for molecular analyses. (B) Quantification of CCTFs and ICAM in brain after pFUS. The y axes represent picograms per milliliter; the x axes represent hours post pFUS+MB. For the sham control brains, no pFUS+MB was administered. (C) Heat map depicting fold changes in CCTFs and CAM over time after brain exposure to pFUS+MB. Protein levels were quantified by ELISA and were normalized to sham control values. Asterisks indicate statistically significant elevations (P < 0.05) identified by ANOVA and Bonferroni post hoc tests.

