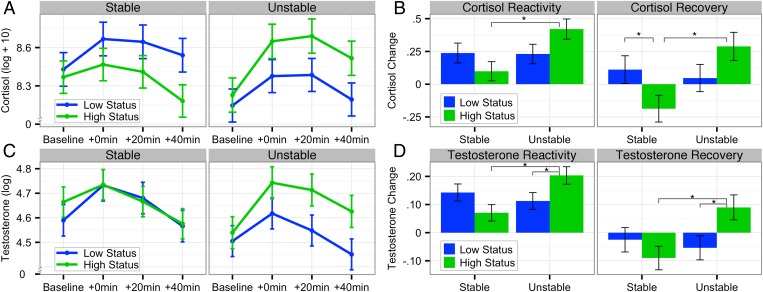
Fig. 2.
Endocrine stress responses as a function of hierarchy stability and social status. (A) Cortisol concentration (log-transformed plus arbitrary value of 10 added) at four points: baseline, +0, +20, and +40 min after TSST. (B) Cortisol reactivity and recovery. (C) Testosterone concentration (log transformed) at four points, controlling for sex. (D) Testosterone reactivity and recovery, controlling for sex. All values are estimated marginal means from relevant models; error bars represent SEMs *Significant uncorrected pairwise comparison at P < 0.05.

