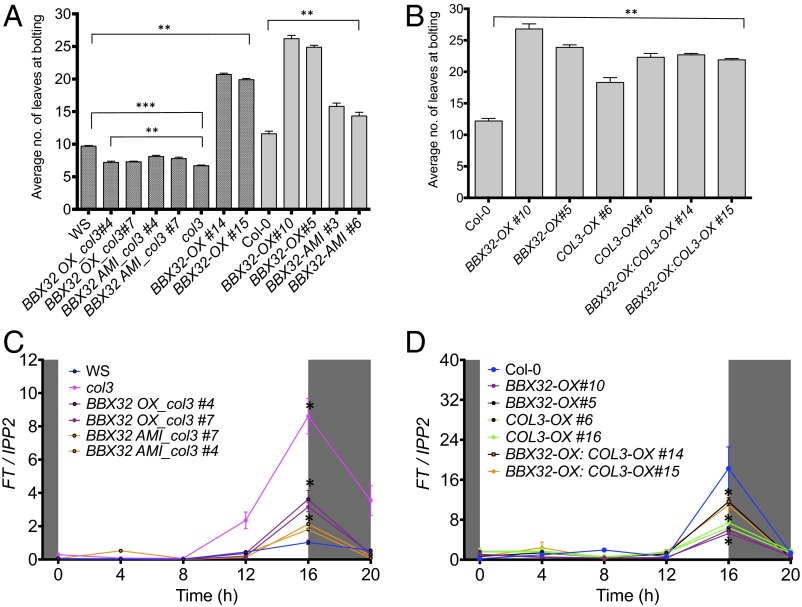
Fig. 3.
Flowering time analysis and expression of FT in overexpression and higher order mutant lines. (A and B) Flowering time analysis was performed on plants grown in 16L:8D cycles at 22 °C for different epitope-tagged single and double transgenic plants. Shaded bars represent mutant lines in WS background. Data shows average number of leaves at bolting, and error bar represents SE (n = 12). ***P ≤ 0.0001; one-way ANOVA (A) and **P ≤ 0.001; unpaired t test (B). (C and D) Relative expression analysis of FT in all epitope-tagged single and double mutants. Experiments were performed on 7-d-old seedlings grown in 16L:8D cycles at 22 °C. Error bars represent the SEM of biological triplicates. Experiments were independently repeated three times, each time with two biological replicates per genotype. Unshaded and shaded area represents light and dark period, respectively.

