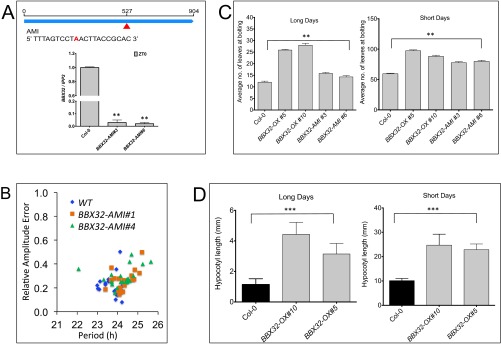
Fig. S2.
Gene expression of BBX32-AMI lines and phenotype analysis. (A) Graphical representation of BBX32 amiRNA and its relative gene expression analysis. Upper represents the single point insertion and the amiRNA sequence targeting BBX32. Lower shows the gene expression analysis of the BBX32-AMI. Wild-type (Col-0), BBX32-AMI seedlings were grown for 6 d in 12L:12D at 22 °C and were harvested on day 7 at ZT0. Error bars represent the SEM of biological triplicates. Experiments were repeated three times independently. **P ≤ 0.001. (B) Relative amplitude error of WT and BBX32-OX seedlings imaged for 5 d under LL conditions calculated by using FFT-NLLS; n = 20. (C) Flowering time analysis of Flag-tagged BBX32-OX and BBX32-AMI. Flowering time analysis was performed on plants grown in 16L:8D (Long days) and 8L:16D (Short days) cycles at 22 °C. Data shows average number of leaves at bolting, and error bars represent SE (n = 12). **P ≤ 0.001; unpaired t test. (D) Hypocotyl length of Flag-tagged BBX32-OX. Flag-tagged BBX32-OX show long hypocotyl phenotype in both long (16L:8D) and short days (8L:16D). ***P ≤ 0.0001; unpaired t test.

