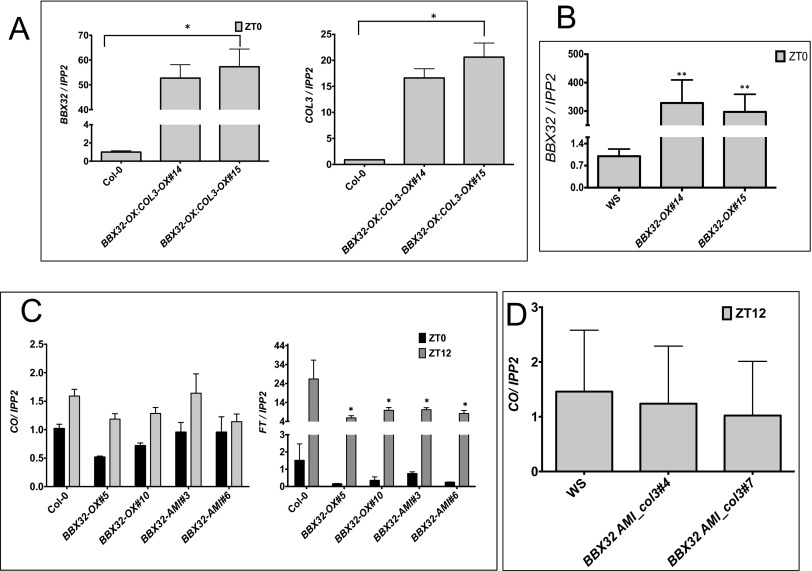
Fig. S5.
Gene expression analysis of BBX32, CO, and FT. (A) Relative expression of BBX32 and COL3 in BBX32-OX: COL3-OX. Wild-type (Col-0), BBX32-OX:COL3-OX seedlings were grown for 6 d in 12L:12D and harvested on day 7 at ZT0. (B) Relative expression of BBX32 in BBX32-OX in WS background. Wild-type (WS), BBX32-OX seedlings were grown for 6 d in 12L:12D and harvested on day 7 at ZT0. Error bars represent the SEM of biological triplicates. Experiments were repeated three times independently. *P ≤ 0.05. (C) Relative gene expression analysis of CO and FT. Seven-day-old wild-type (Col-0), FLAG-tagged BBX32-OX and BBX32-AMI seedlings grown in long-day conditions (16L:16D) were harvested at ZT0 and ZT12. Error bars represent the SEM of biological triplicates. Experiments were repeated three times independently. (D) Gene expression analysis of CO. Seven-day-old wild-type (WS) and BBX32-AMI_col3 seedlings grown in long-day conditions (16L:16D) were harvested at ZT12. Error bars represent the SEM of biological triplicates. Experiments were repeated three times independently with two biological replicates per genotype.

