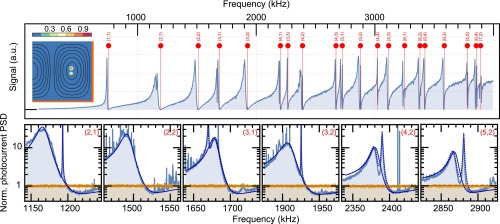
Fig. 3.
(Top) Multimode OMIT in the cavity response, with expected frequencies indicated by red lines (for clarity, ), labeled with the mode index. Inset shows the extracted location of the optical beam within one quadrant of the membrane, with color-coded normalized probability density. Contours of equal displacement of the (3,2) mode are also shown, with the membrane’s clamped edges indicated in orange. (Bottom) Strong simultaneous light squeezing from six mechanical modes. Blue traces are the recorded cavity output spectra, and orange is the shot noise level. The solid blue line shows the single-mechanical mode model, and the dashed blue line shows the two near-generate mechanical modes model. Differences are discussed in SI Appendix.

