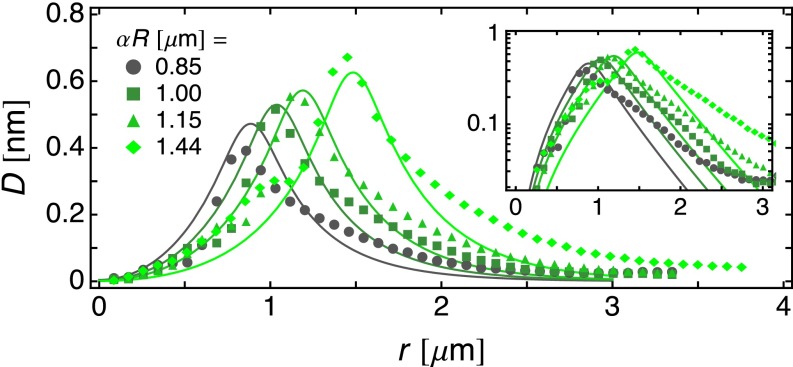
Fig. 4.
Retardance values for rafts of various radii . The points indicate experimental data and the lines indicate theoretical results calculated with and the parameter values in Table 1, corresponding to twist penetration depth and chiral wavenumber difference . is given by Eq. 5 and is adjusted to produce rafts of different radii. Experimental data and methods are reported in ref. 18.

